


Hi Friend 👋
Did you know that Compounding Quality 2.0 has arrived? We transform into a full investment platform. The price of this full platform? $1,200 per year. It’s for serious investors only.
The good news? People who subscribe this month can still get it for the regular rate. This means you only pay $499 per year for as long as you stay subscribed.
Get access to the Portfolio, Full Investment Cases, CEO Talks, and much more:


The Compounding Quality Universe just got an upgrade.
We created a Buy-Hold-Sell List based on our watchlist of 143 Quality Stocks.
Let’s find out which stocks are a ‘Buy’ right now.

Our Universe
Did you check out Our Investable Universe already?
It’s a list of 143 high-quality stocks.
We use this framework to select stocks:

Outperformance
The investable universe outperformed the S&P 500 by more than 5% per year since 2011.
The fundamentals look like this:
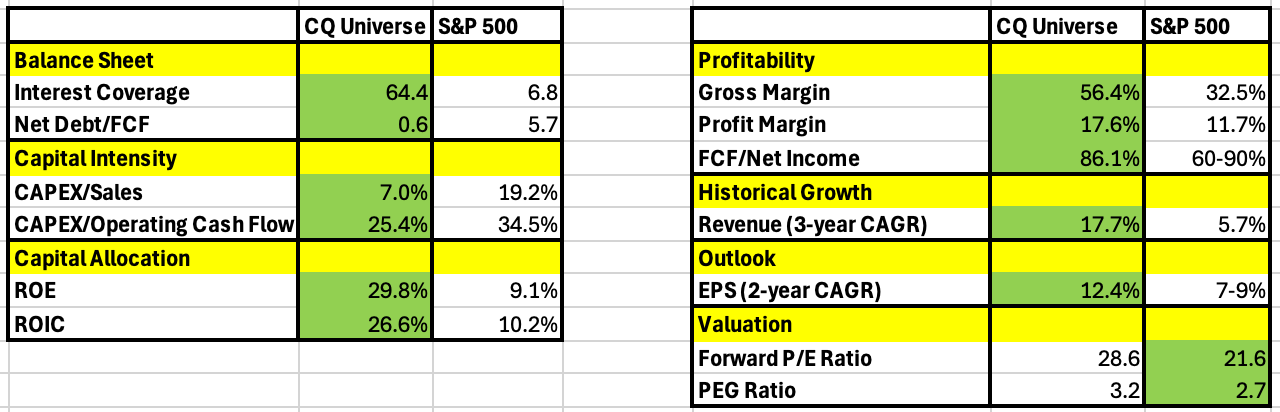
As you can see, the Universe scores better than the S&P 500 on (almost) every single metric:
Our companies have a healthier balance sheet
They operate at a lower capital intensity
Their capital allocation is better
They are more profitable
They managed to grow more than the index AND the outlook looks better
The only metric on which the S&P 500 scores better is valuation.
That’s exactly why we are trying to pick the undervalued companies within the investable universe for Our Portfolio.
![It's better to buy a wonderful company at a fair price than a fair company at a wonderful price" - Warren Buffett [800x362] : r/QuotesPorn](https://substackcdn.com/image/fetch/$s_!pDw7!,f_auto,q_auto:good,fl_progressive:steep/https%3A%2F%2Fsubstack-post-media.s3.amazonaws.com%2Fpublic%2Fimages%2F05832cab-891c-4601-9978-e1a52e278e78_640x289.png "It's better to buy a wonderful company at a fair price than a fair company at a wonderful price\" - Warren Buffett [800x362] : r/QuotesPorn")
Buy-Hold-Sell List
You’ve had access to the watchlist for quite some time already as a Loyal Partner.
Today, we introduce a Buy-Hold-Sell List for each company on the watchlist.
The Buy-Hold-Sell List only consists of high-quality companies.
Three methods are used to value each stock:
Comparing the forward PE multiple to its historical average
Earnings Growth Model
Reverse Discounted-Cash Flow
Each month, we update everything and use the results to create this Buy-Hold-Sell List:
Buy: Quality stocks to consider buying right now
Hold: Quality stocks that are a bit expensive
Sell: Quality stocks you might want to sell if you already own them
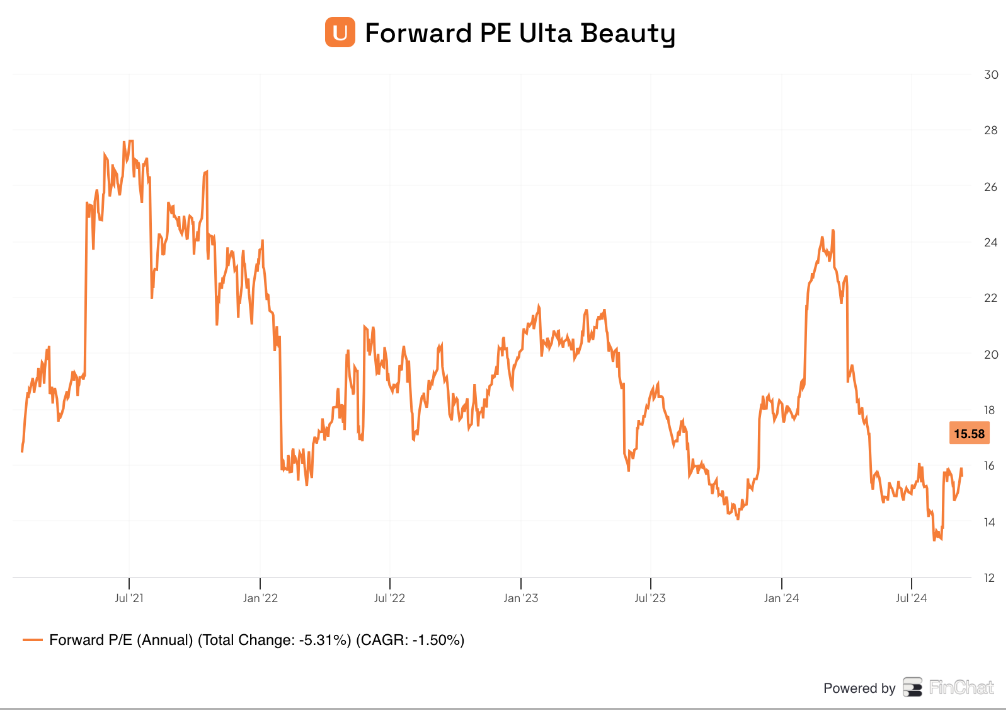
1️⃣ Comparing the PE with the forward PE
The forward P/E shows how much investors are willing to pay for a company.
The lower the forward P/E, the cheaper the stock.
By comparing the forward P/E to its historical average, we get an idea of whether a stock is over- or underpriced.
For example, Ulta Beauty has a forward P/E of 15.9x, compared to its historical average of 25.6x over the past 10 years.
This indicates Ulta Beauty is undervalued compared to its historical average.
The Forward PE indicates a company is undervalued if:
Current Forward PE < 10-Year Average Forward PE
Here are the companies within the watchlist that are the most undervalued compared to their average forward PE:

Out of the 143 companies within Our Watchlist, 40 (28.0%) are undervalued compared to their historical average.
Companies that stand out? Lululemon Athletica, Qualys, Evolution AB, Ulta Beauty, and Inter Parfums.
2️⃣ Earnings Growth Model
This model shows you the yearly return you can expect as an investor.
In theory, it’s easy to calculate your expected return:
Expected return = EPS Growth + Dividend Yield +/- Multiple Expansion (Contraction)
EPS Growth: The expected EPS growth over the next 10 years
Dividend Yield: Dividend Per Share / Stock Price
Multiple Expansion (Contraction): The yearly change in valuation over the next 10 years. We assume the company will evolve to its fair exit PE
Exit PE: the multiple we consider fair for the company in the long term
A company is undervalued based on this valuation method if the expected yearly return in the Earnings Growth Model is larger than 10%.
Fair Value
Based on the Earnings Growth Model (EGM), we calculate a Fair Value for every company.
The fair value is calculated by turning the EGM upside down:
Fair Value = The multiple you could pay to receive a 10% return as a shareholder
You calculate the Fair Value by multiplying this multiple by the expected EPS for the next 12 months.
Sounds strange?
Let’s use Visa as an example to clarify.
Here are the assumptions used:
EPS Growth = 12.0% per year over the next 10 years
Dividend Yield = 0.7%
I consider an exit PE of 26.3x (= historical average Forward PE) as fair in the long term
You need to calculate the multiple you could pay for Visa to receive a return of 10%.
Expected return = EPS Growth + Dividend Yield +/- Multiple Expansion (Contraction)
10% = 12.0% (EPS Growth) + 0.7% (Dividend Yield) - 0.1* (26.3x - Multiple you could pay)/ Multiple you could pay
When you do the math, the multiple you could pay equals 35.0x times earnings.
Now we know this, we can calculate the Fair Value of Visa:
Fair value = Multiple you could pay * expected EPS next 12 months
Fair value = 35.0x * $9.9 = $346.8
As Visa’s current stock price is $288.5, Visa is undervalued by 20.2%.
Do you want to see the companies that are the most undervalued based on the Earnings Growth Model?
As well as the companies that are a ‘Buy’ within our Investable Universe?
Become a Partner of Compounding Quality and find out right away.

🔥Compounding Quality 2.0 🔥
Did you know that 🔥Compounding Quality 2.0 🔥- A New Era is arriving?
The ⭐Founding Subscription ⭐ is launching this week.
Here’s what you’ll get (among others):
📈 Only Founding Subscribers get access to the Portfolio
🔎 A Buy-Hold Sell List with 147 Quality Stocks
📊 Attend private Zoom meetings
✍️ A dedicated Community where you can ask all your questions
…
The price will be $1,200.
However, everyone who subscribes this week will get it for the regular rate.
Take the annual plan of $499 and receive a free upgrade:
Everything in life compounds
Pieter (Compounding Quality)
Book
Order your copy of The Art of Quality Investing here
Used sources
Interactive Brokers: Portfolio data and executing all transactions
Finchat: Financial data