A Look Into Our Portfolio
Do you want a true reflection of the Intrinsic Value of your Portfolio?
Look at the Owner’s Earnings.
Let’s teach you everything you should know about this amazing metric.
What are Owner’s Earnings?
By looking at the Owner’s Earnings, you look at the fair or intrinsic value of a company.
You can calculate the Owner’s Earnings as follows:
Owner's Earnings = EPS Growth + Dividend YieldIt’s important because in the long run, stock prices always follow the intrinsic value of a company.
As a result, you can calculate the expected return for you as a shareholder.
Let’s use the S&P 500 as an example.
The following graph compares the S&P 500 with its Forward 12-month EPS (≈ Owner’s Earnings).
The overlap is remarkable:
François Rochon (Giverny Capital) proved something similar.
As you can see in the table below, Giverny Capital’s Portfolio increased its Owner’s Earnings by 12.9% (3,266% in total) while the stock price rose by 13.0% per year (3,344% in total).
That’s almost identical!

How to value a company?
To look at the expected return of your Portfolio, you need to determine two things:
How much the company will earn (EPS) in 5 years from now
The fair P/E multiple at which you think this company should trade over time
Let’s say Company X earns $1 per share today and trades at a P/E multiple of 18x.
You make the following assumptions:
The company will earn $2 per share in 5 years from now
A fair P/E multiple would be 20x
In that case, your expected return looks like this:
Stock price = EPS * P/E multiple
Stock price today = $1 * 18 = $18
Stock price in 5 years from now = $2 * 20 = $40
When your assumptions are correct, your return would equal 122.2% or 17.3% per year.
I want to earn 15% per year based on these calculations. This would mean your investment doubles every 5 years.
A hurdle rate of 15% provides me with a Margin Of Safety in case my assumptions are wrong.
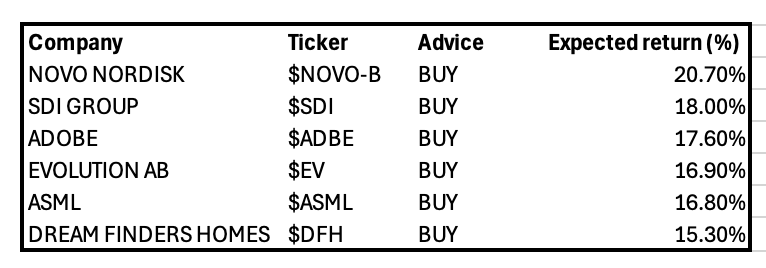
Here are some companies in our universe with an expected return of more than 15%:
Owner’s Earnings Portfolio
You know by now that stock prices follow the evolution of the Owner’s Earnings over time.
When we compare the evolution of the stock prices for Our Portfolio with the Owner’s Earnings, we get the following:
As you can see, the stock price increased by 23.4% versus 22% for the Intrinsic Value (Owner’s Earnings).
This means Our Portfolio became slightly more expensive over time.
However, seeing that the Intrinsic Value of our companies increased by over 20% per year is very satisfactory. It proves once again that we’re invested in great businesses.
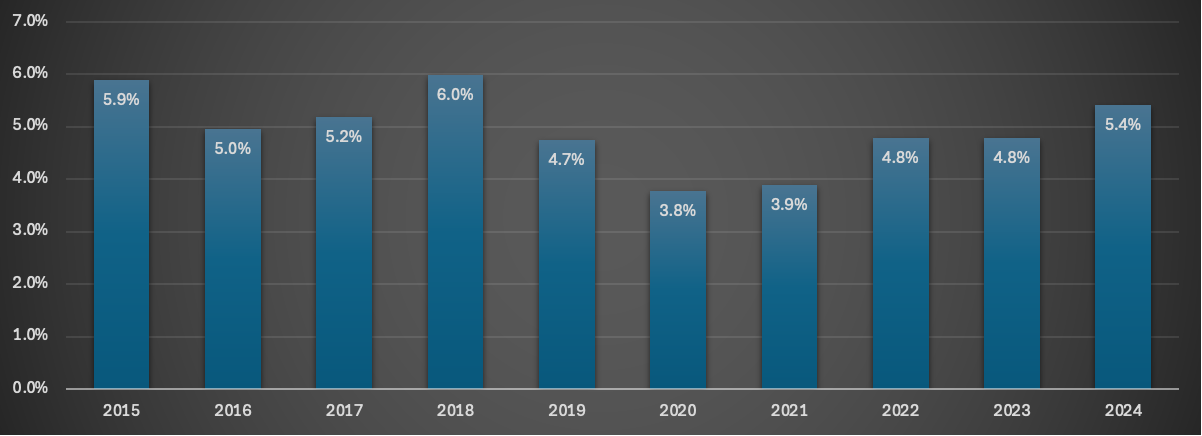
The evolution of the Free Cash Flow Yield for Our Portfolio looks as follows (the higher this number, the cheaper):
Free Cash Flow Growth
The Free Cash Flow of Our Portfolio also grew at very attractive rates.
When we compare the FCF growth with the stock price performance, we get the following:
I expect Our Companies to grow their FCF by 12% to 15% per year in the years ahead.
Undervalued Companies in Our Portfolio
To determine which companies are undervalued in Our Portfolio right now, we compare the Owner’s Earnings with the stock price.
For four companies in Our Portfolio, the Owner’s Earnings grew harder than the stock price in the recent past.


