

Hi Partner 👋
Do you know the odds of a public company becoming a 100-bagger?
It’s lower than 3%.
And the average time it takes to get there?
Roughly 26 years.
Yet one Swedish business family has managed to produce two 100-baggers and an 80-bagger.
And almost as impressive: one of those companies reached 100x in just 22 years.
The next potential company in line? It could be Momentum Group AB ($OM-MMGR B).
It’s the smallest listed company from the same family.
Let’s dive into this interesting small company today.
1. How does Momentum Group make money?
1. History
A fantastic story of an overlooked company? Bergman & Beving.
This Swedish company laid the foundations of what we know today as a “serial acquirer”.
Way before Constellation Software (1995), and others…
Bergman & Beving started its acquisition growth strategy in 1967.
They started buying distribution companies.
9 years later, in 1976, they went public.
Since then, the stock has been a 7,500 bagger.
This means $1.000 turned into $7.5 million.
Along the way, Bergman & Beving’s structure has changed several times to keep the entrepreneurial spirit alive:
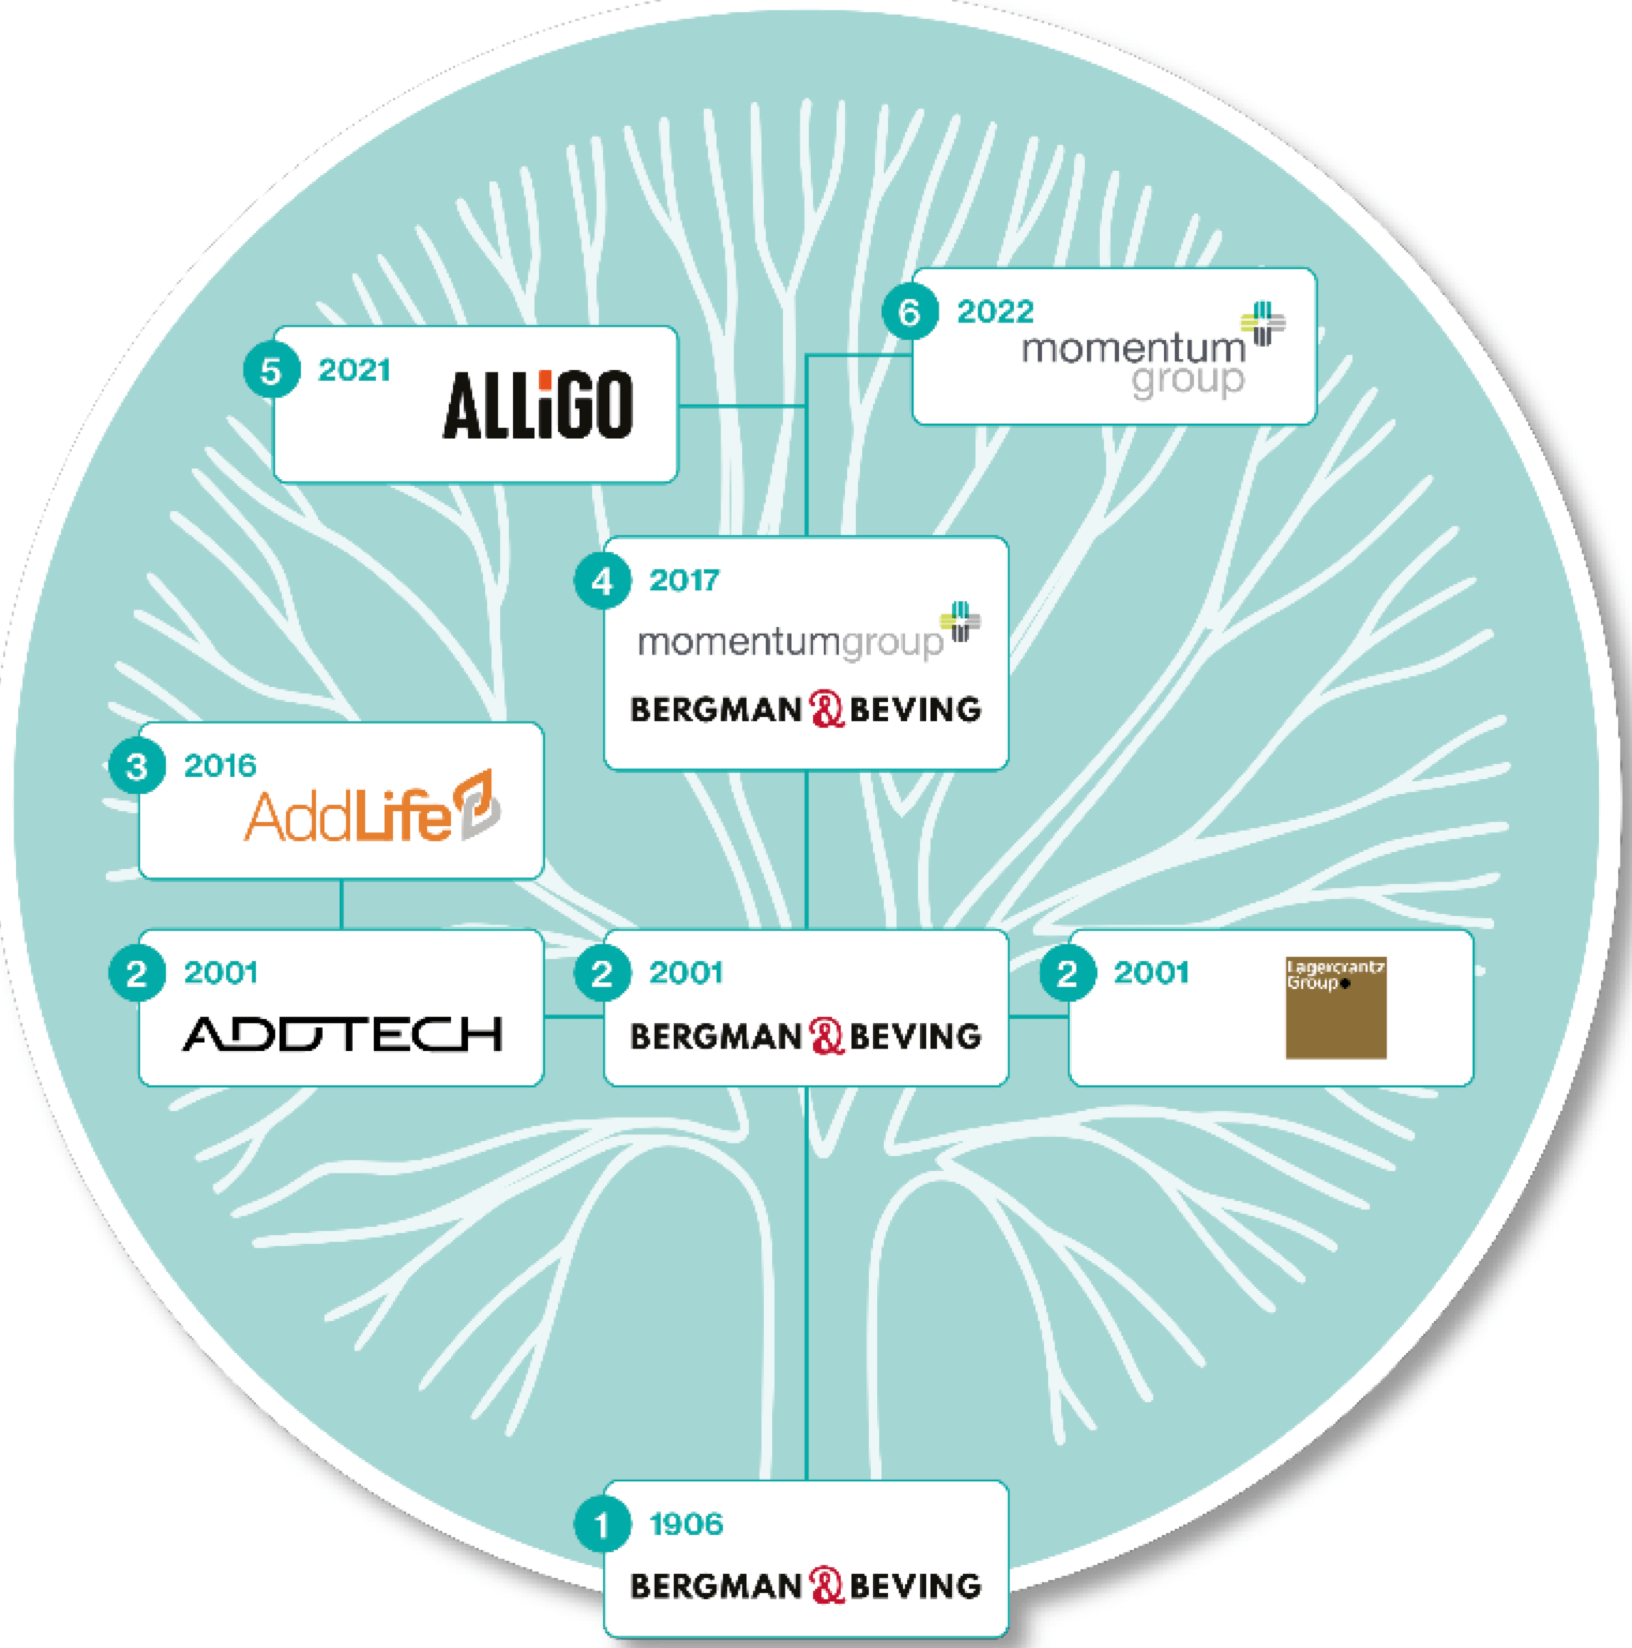
The reasoning behind these spinoffs shown above is to stay small and lean.
It’s like what Mark Leonard from Constellation Software says:
“We want to become big by staying small” - Mark Leonard
In 2001, Bergman & Beving was split into 3 segments:
Bergman & Beving stayed, but was renamed B&B Tools. It was later renamed Bergman & Beving again.
Addtech was spun off in 2001.
Lagercrantz Group was also spun off in 2001.
Both Addtech and Lagercrantz are sector-agnostic acquirers.
It means they operate across several industries rather than focusing on a single sector.
However, their companies can mostly be seen as industrials. They don’t invest in software.
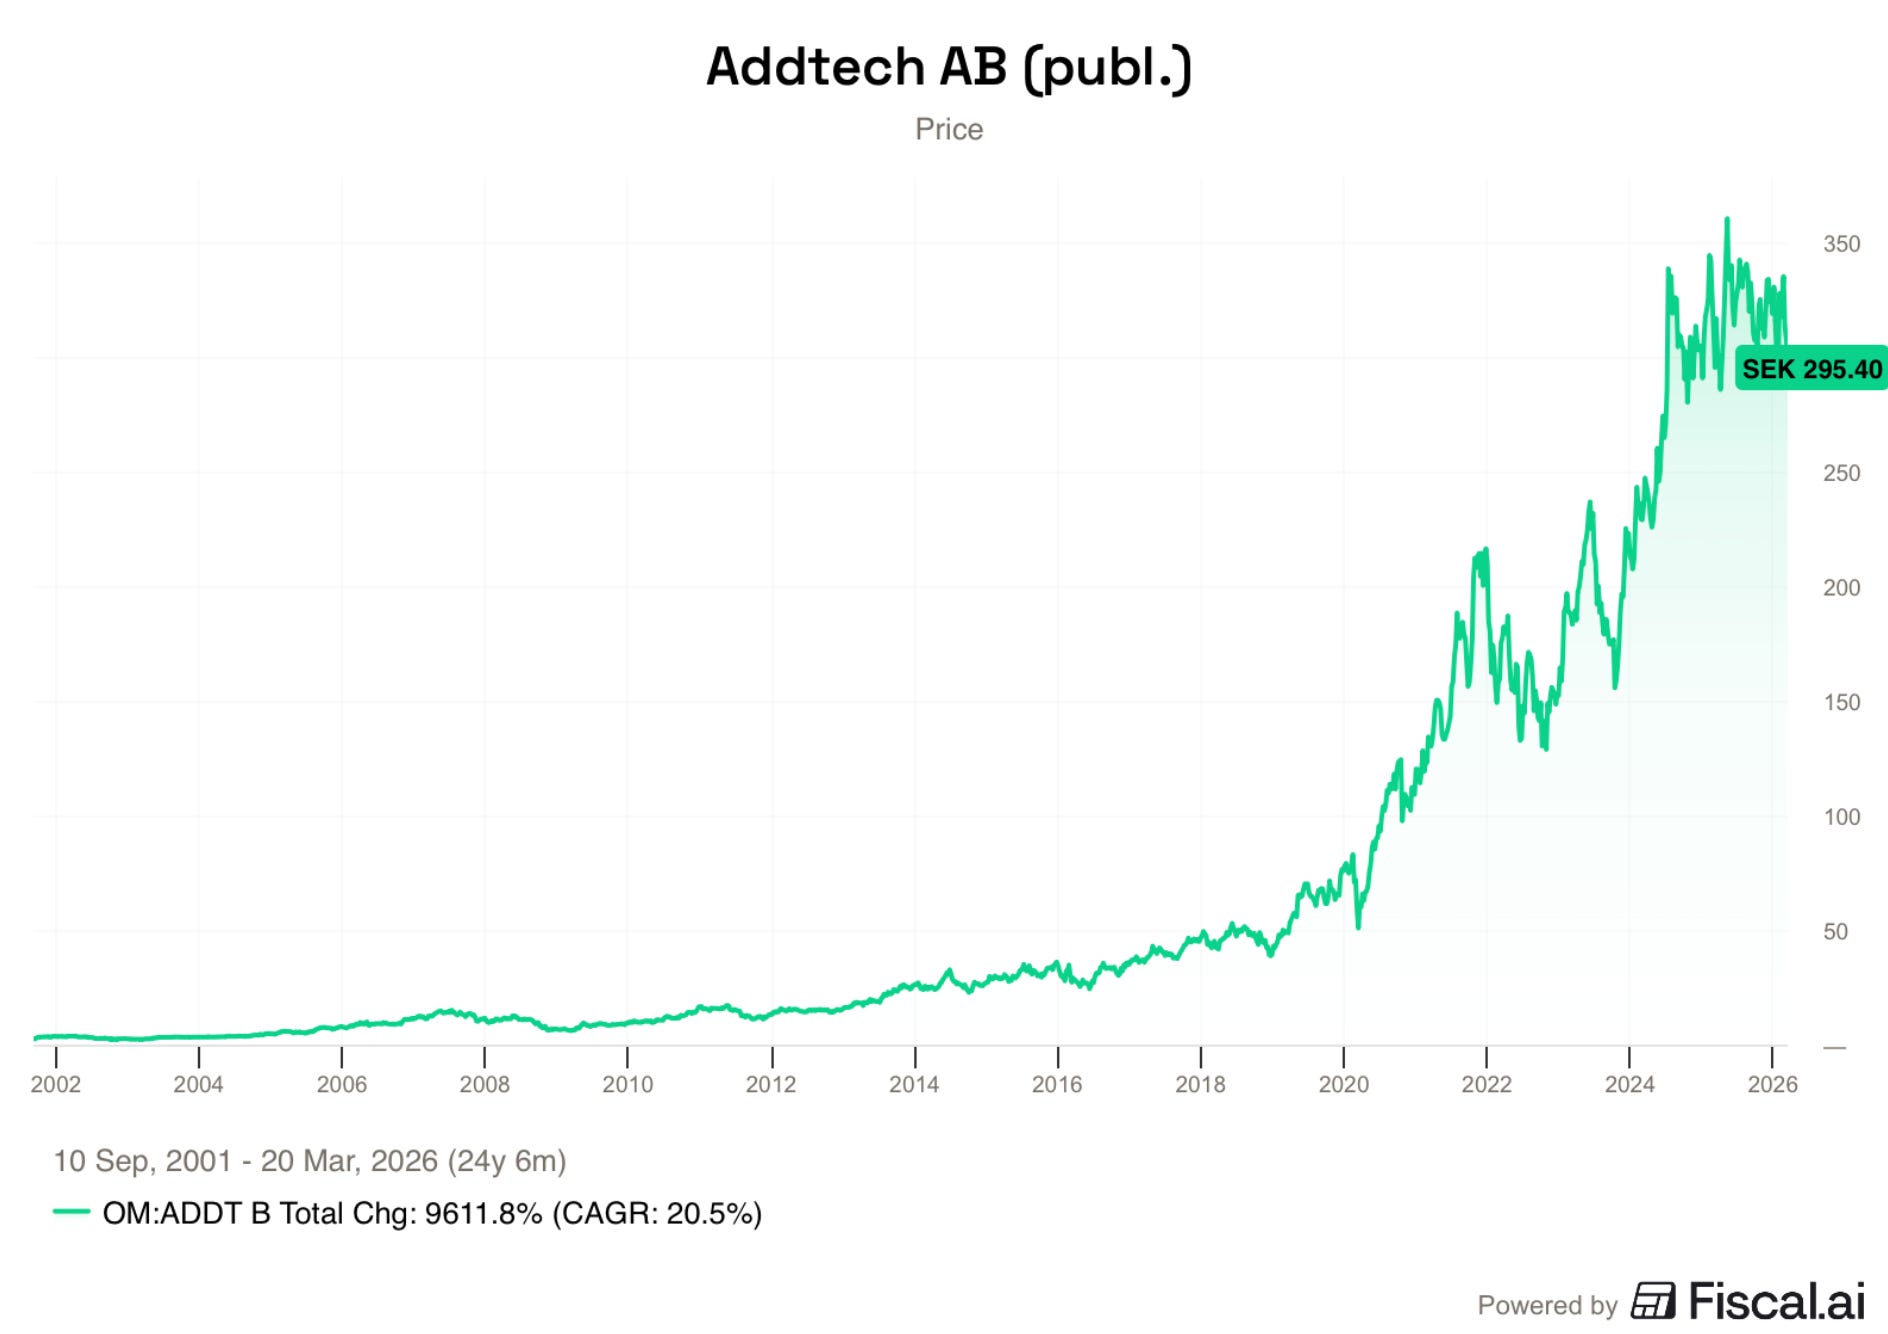
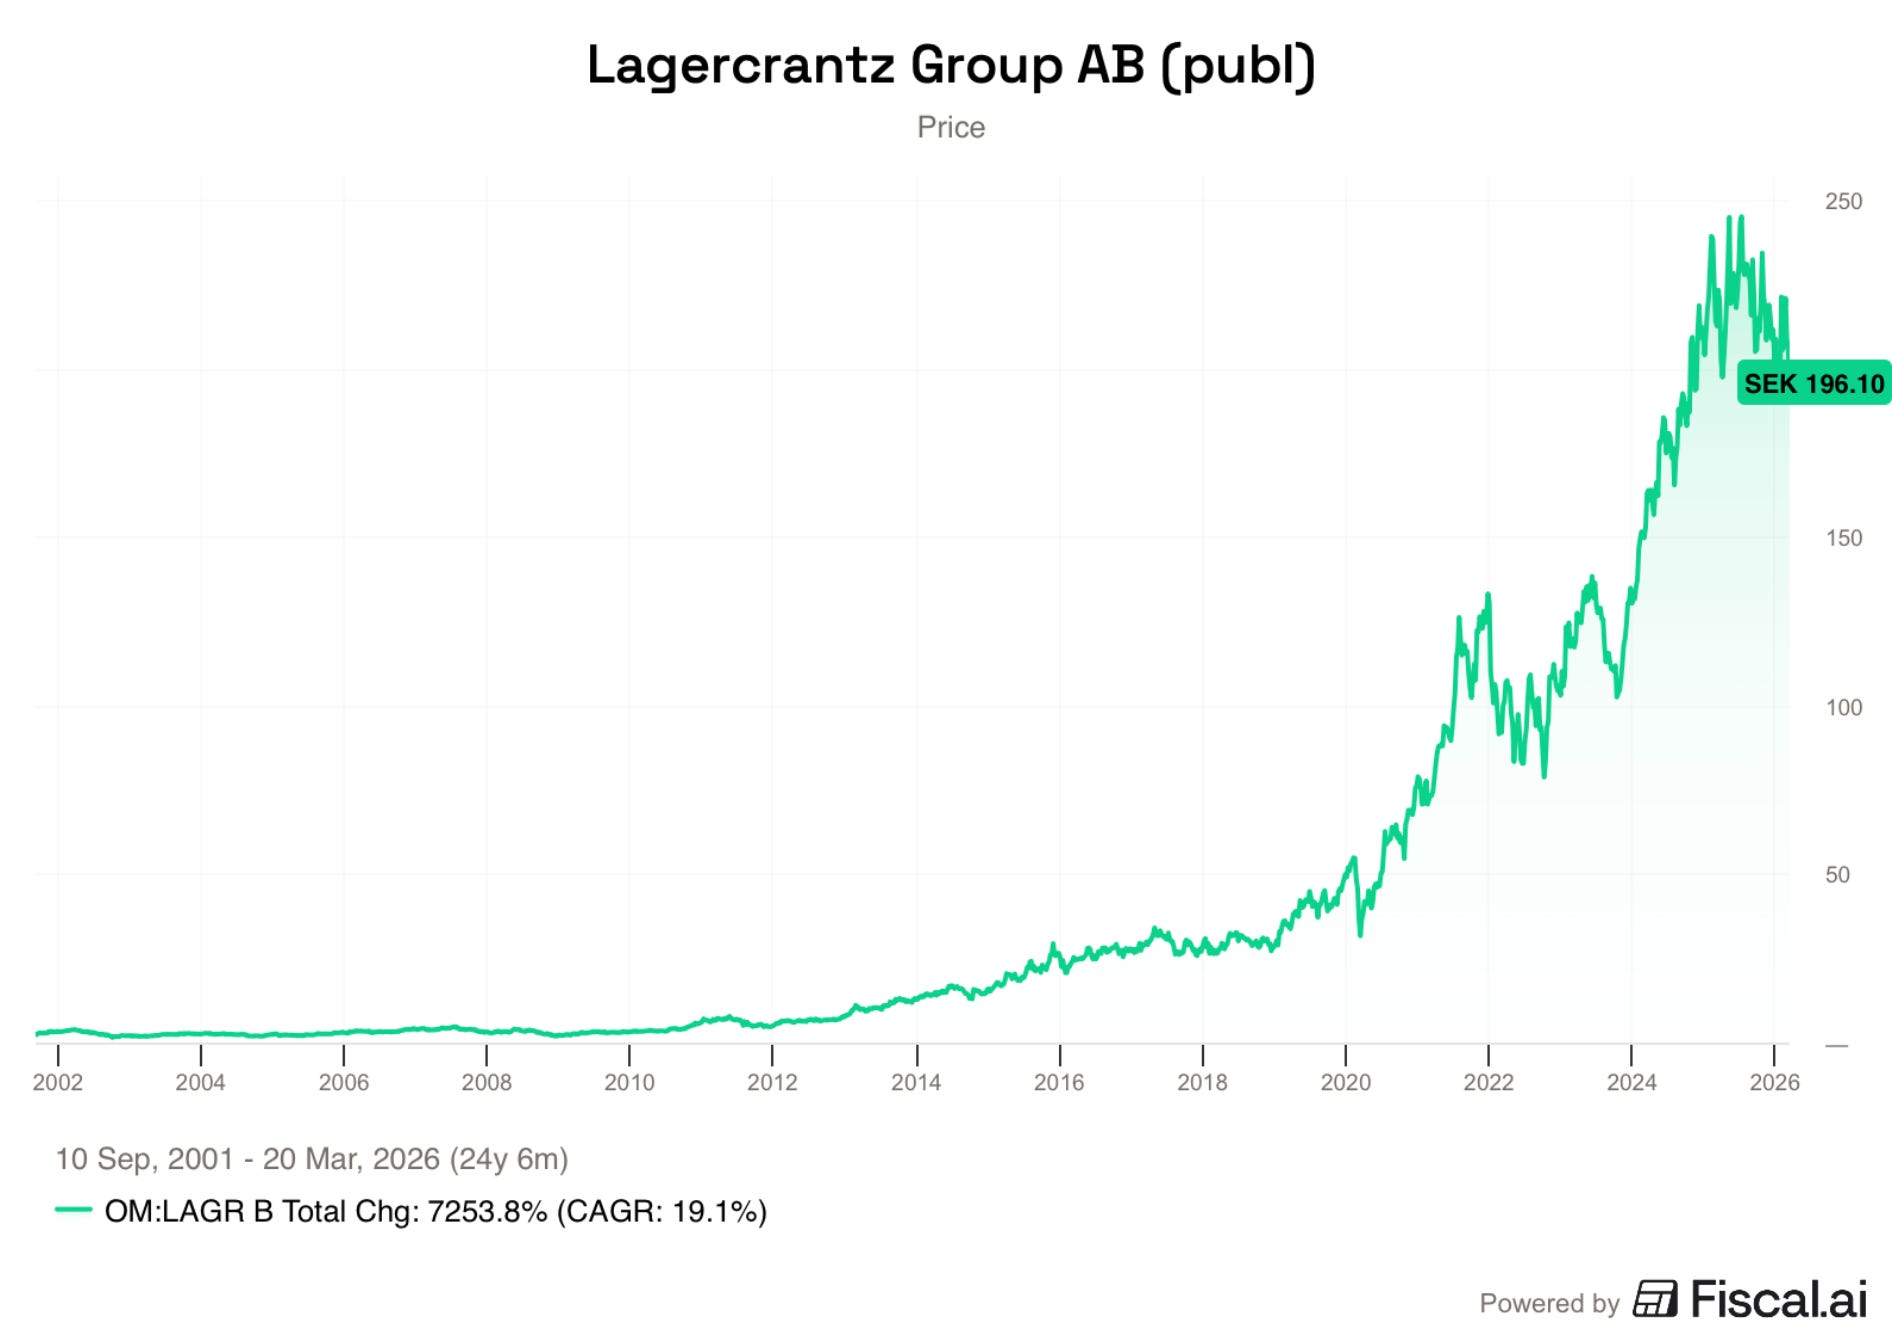
Let’s look at the price charts of these two spin-offs.
Addtech has grown its share price at a CAGR of over 20% since 2001. It’s a 96-bagger:
And what about Lagercrantz Group? A very similar story:
In 2016, Addtech spun off AddLife.
AddLife focuses more on the medical industry.
They also created significant shareholder value:
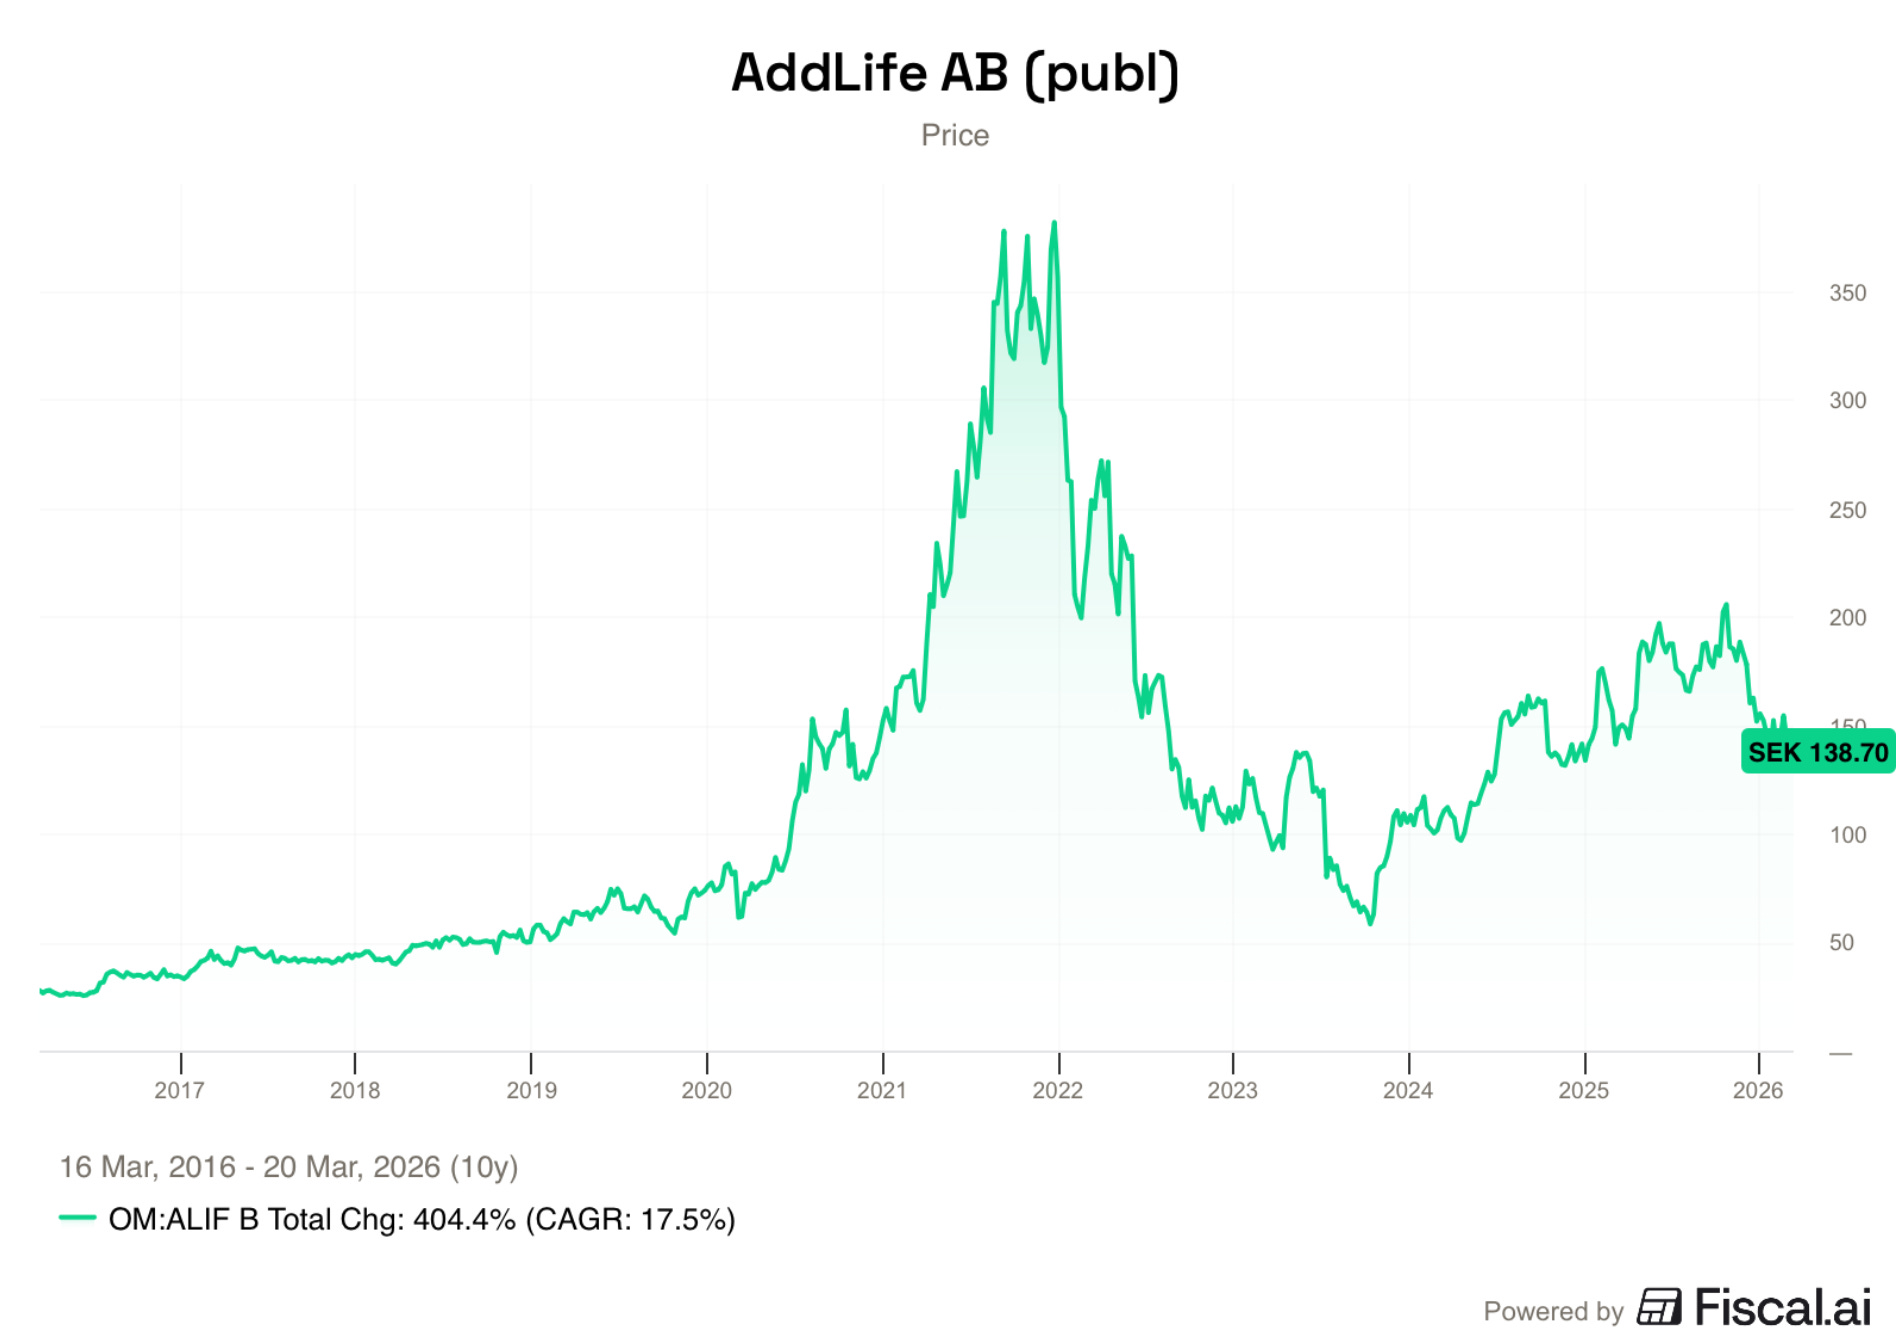
Isn’t that remarkable?
All these companies from the same family significantly outperformed the broader market.
This brings us to Momentum Group.
It is the most recent company that spun off from the impressive Bergman & Beving family.
In 2017, Momentum Group was spun off from Bergman & Beving.
This spin-off was later split into two different entities: Alligo and Momentum Group.
For all clarity, it’s this new Momentum Group 2.0 that we are looking at here.
If you’re a bit lost in the history of Momentum, this visual can help:

This epic Swedish compounding story reminds us a bit of Constellation Software and its spinoffs: Topicus and Lumine.
While Constellation and its spinoffs operate in a completely different industry (Vertical Market Software), their entrepreneurial spirit and philosophy are very similar.
An interesting fact?
Mark Leonard once went to Sweden to study the Bergman & Beving family.
2. A specific look at Momentum Group 2.0
Momentum Group operates as an acquirer of industrial distributors.
They currently own 35 subsidiaries, mainly in the Nordics, as well as one company in the UK.
When it comes to serial acquirers, cash is everything.
You can’t pay for acquisitions with accounting profit. It requires real cash flow.
This is exactly why the serial acquirer model works great with distribution companies.
Here is why:
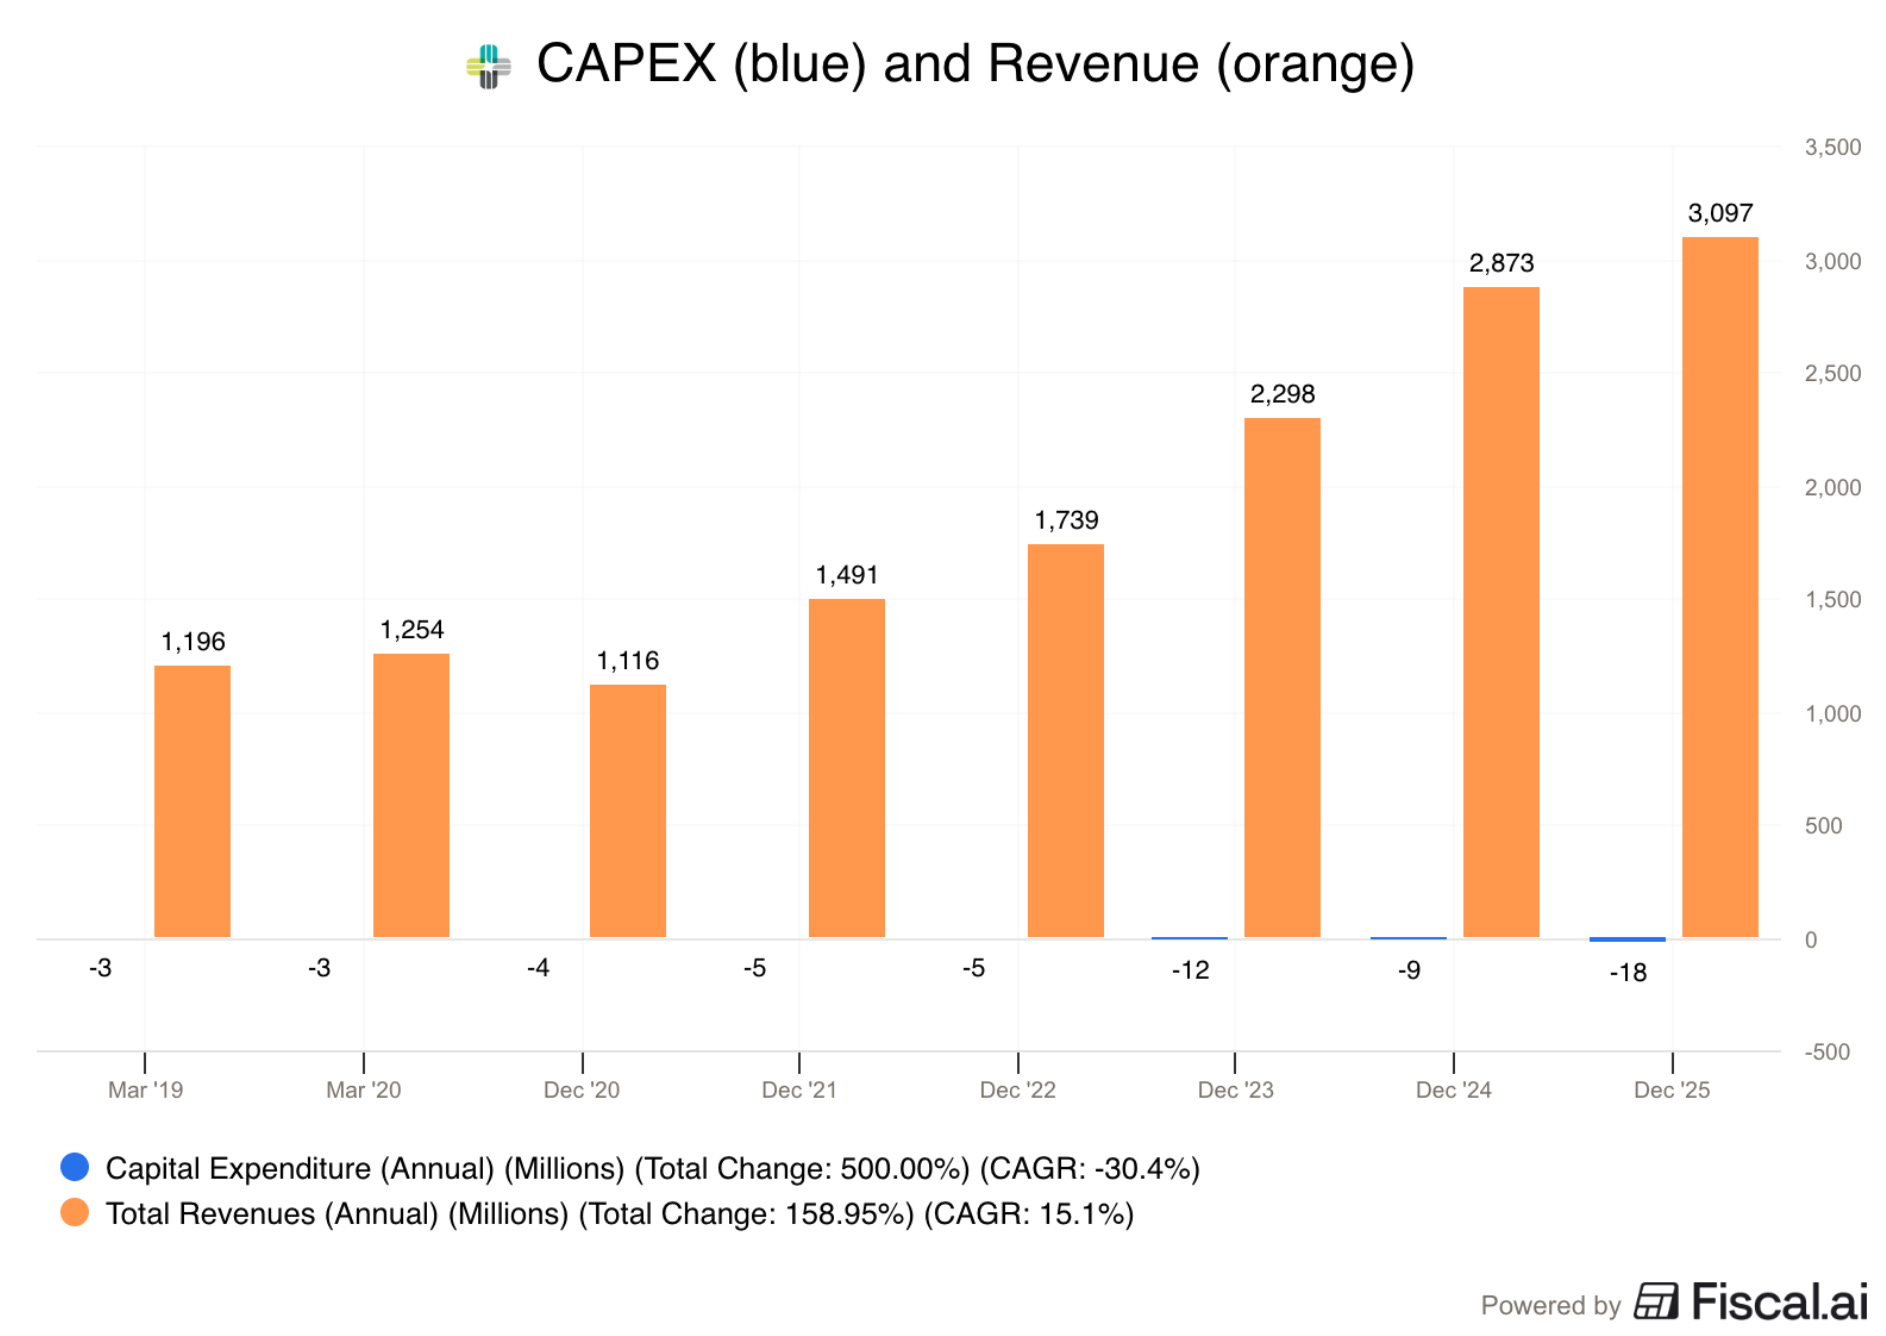
They are capital-light: distributors aren’t producing anything. As a result, they don’t need heavy machinery or big factories. This translates into low CAPEX requirements. As you can see, the company has almost no CAPEX needs (on the chart, it’s almost impossible to see CAPEX):
A maniacal focus on working capital: Momentum’s EBITA/Working Capital ratio stands at 58%. For distributors that need to hold large inventories, this is an exceptionally high score. To give you an example of the inventory requirements, only 5% of the products Momentum sells yearly are sold again within three years. The internal target is to keep EBITA/Working Capital above 45%.
Momentum Group clearly excels in working capital management.
The incentives of subsidiaries and employees are also tied to the EBITA/Working Capital metric.
For example, subsidiaries whose EBITA/Working Capital is above 45% get the freedom to grow their companies inorganically via add-on acquisitions.
So to a certain extent, capital allocation is also decentralized at Momentum, which is not something you typically see at Swedish serial acquirers.
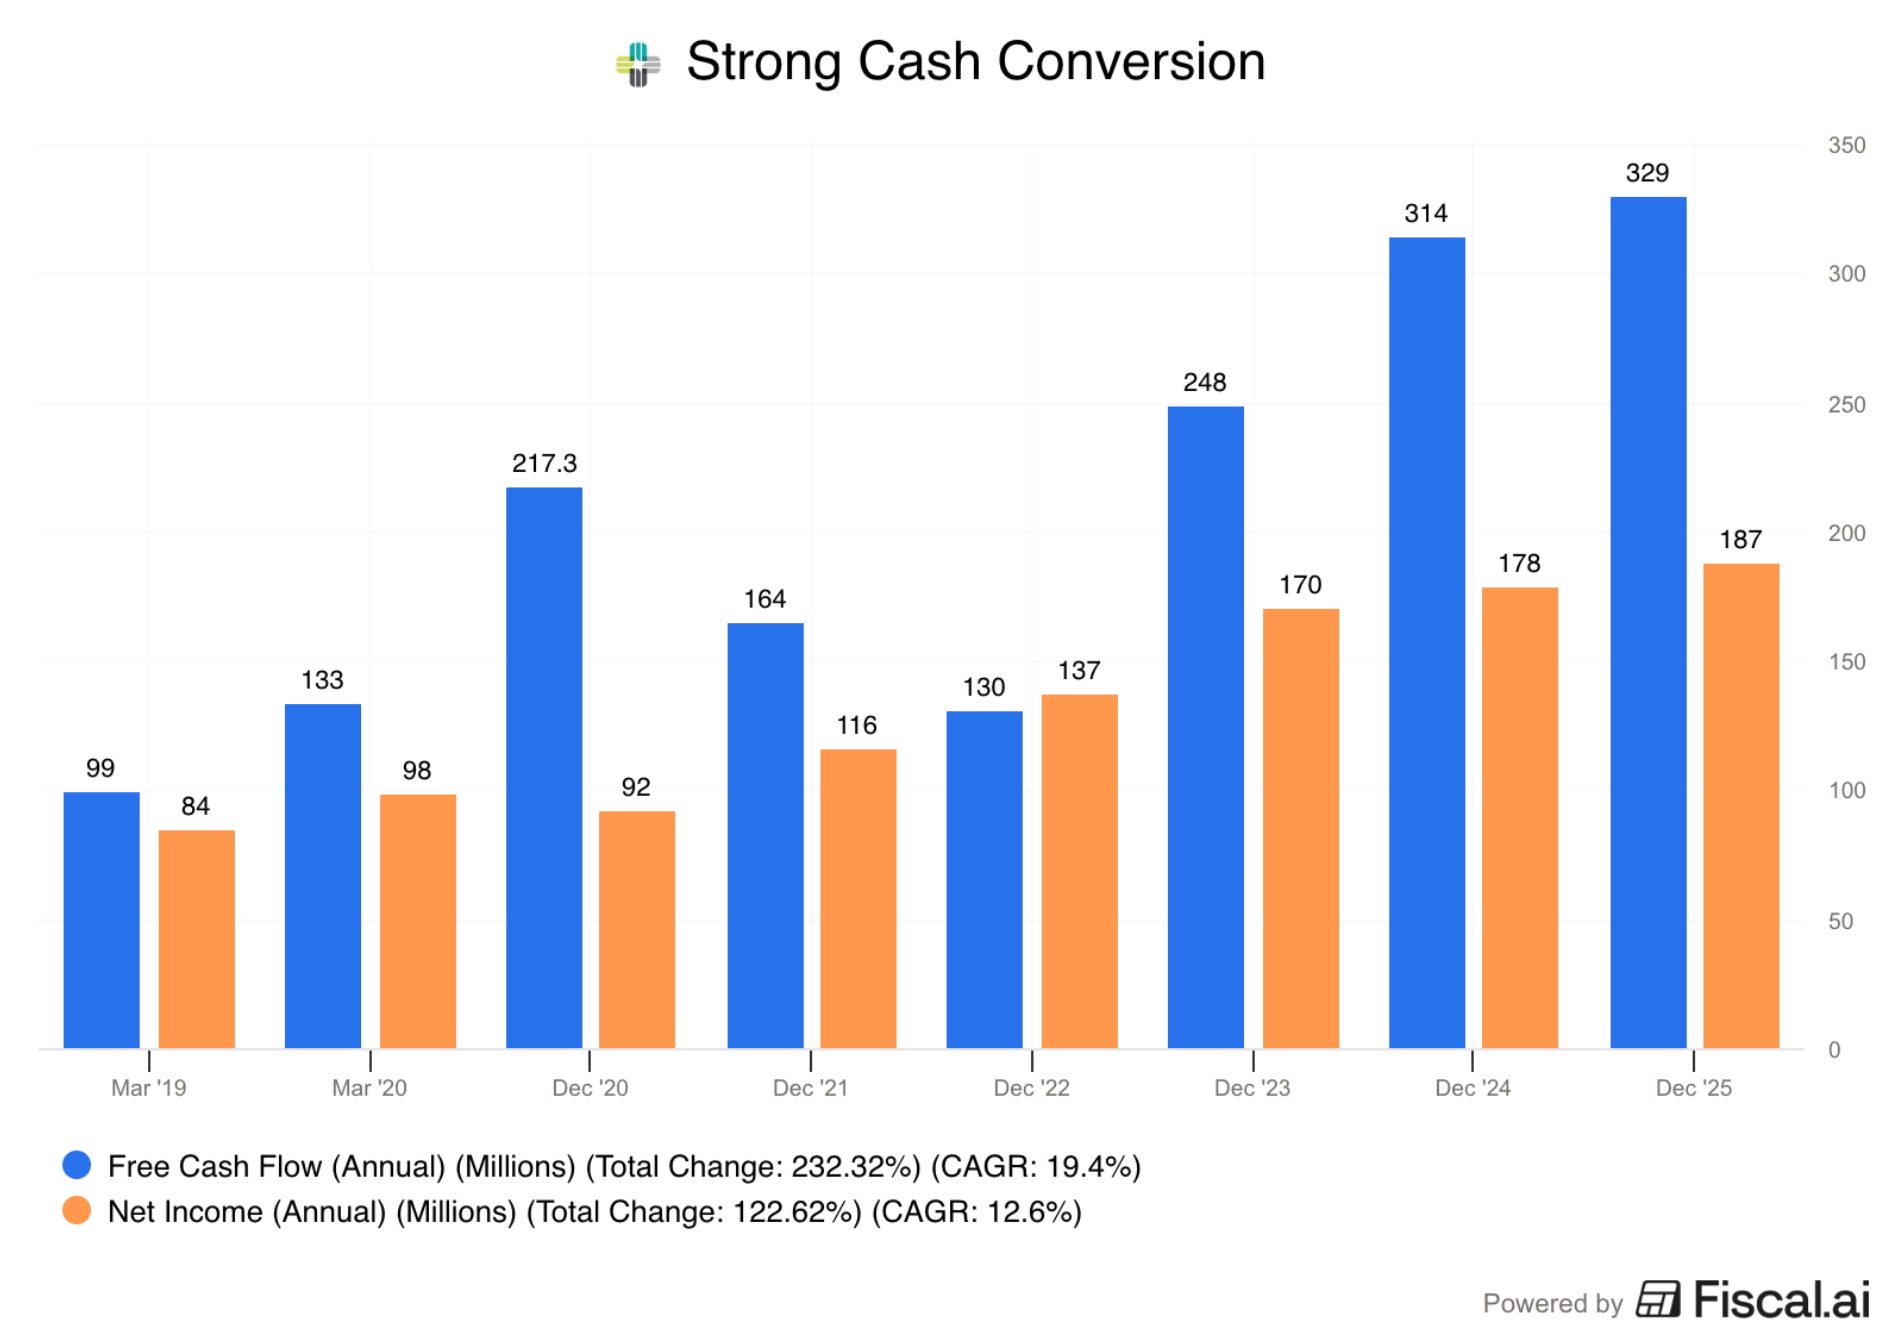
This combination of low CAPEX requirements and excellent working capital management has created a true cash machine.
Free Cash Flow has historically been higher than Net Income. And remember that Free Cash Flow is very important for serial acquirers.
Keep in mind that this big gap between Net Income and Free Cash Flow isn’t entirely driven by low CAPEX requirements and strong working capital management.
Big amortization expenses are also part of the explanation.
This is typical for serial acquirers. They amortize the goodwill that comes from doing the acquisitions.
This artificially lowers Net Income.
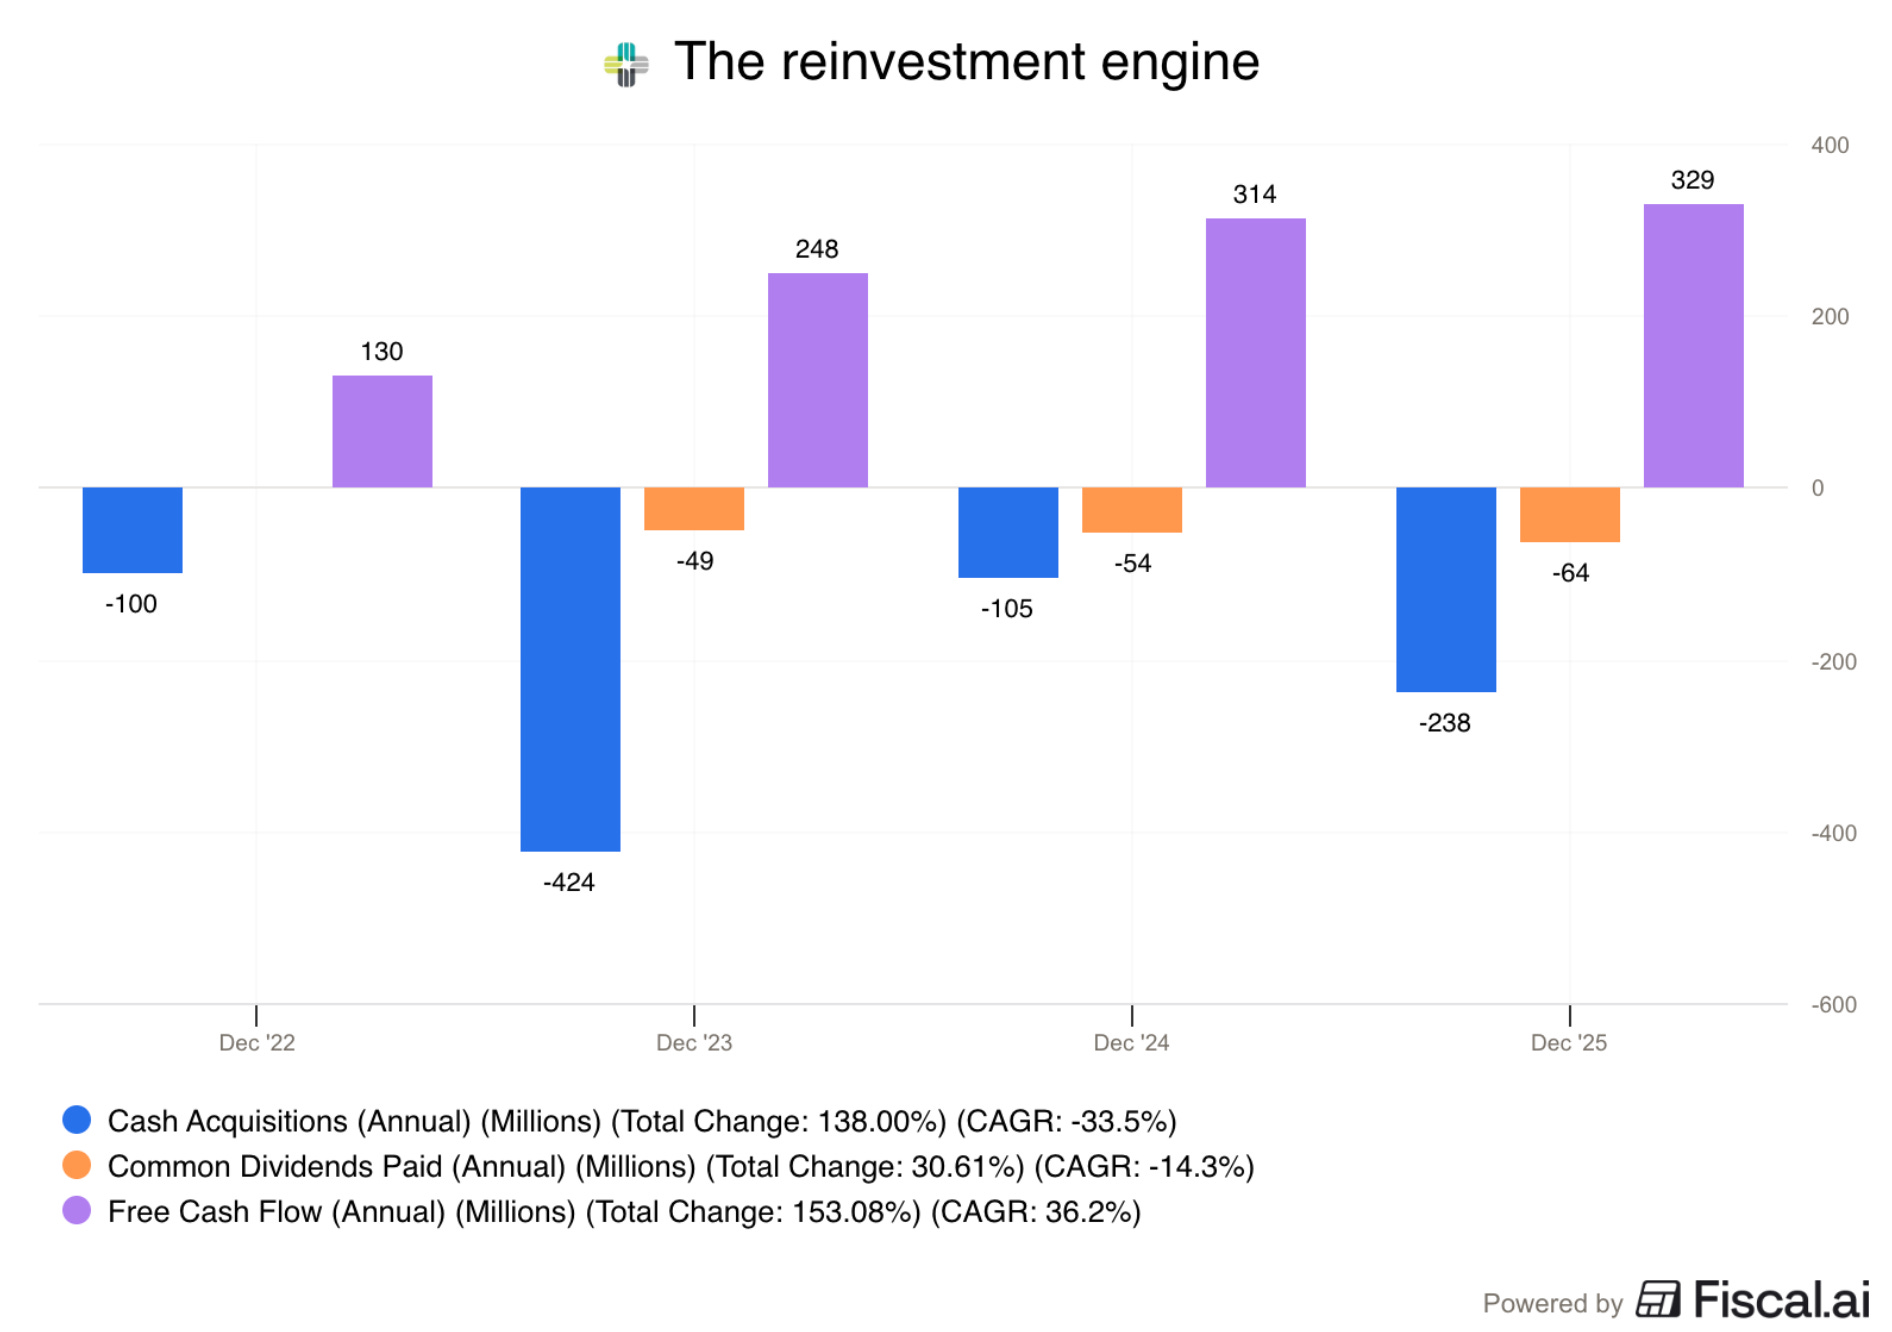
The vast majority of this Free Cash Flow is reinvested into acquisitions.
Momentum Group also pays a small dividend:
Where the story becomes even more interesting is in Momentum’s type of distribution: critical aftermarket components for industrial companies.
They primarily supply components critical to keeping expensive machinery running.
Machine downtimes are very expensive. Momentum tries to minimize this by being a reliable distributor of spare parts.
This focus on the aftermarket also creates a resilient business model.
Aftermarket sales can be seen as recurring revenue and are less dependent on economic cycles.
Next to distribution companies, Momentum also owns some industrial service businesses.
2. Management
Momentum’s CEO is Ulf Lilius.
He owns roughly 1.4% of the company.

We like two things about Lilius: his track record and his personality type.
Let’s go over them:
1. Track record
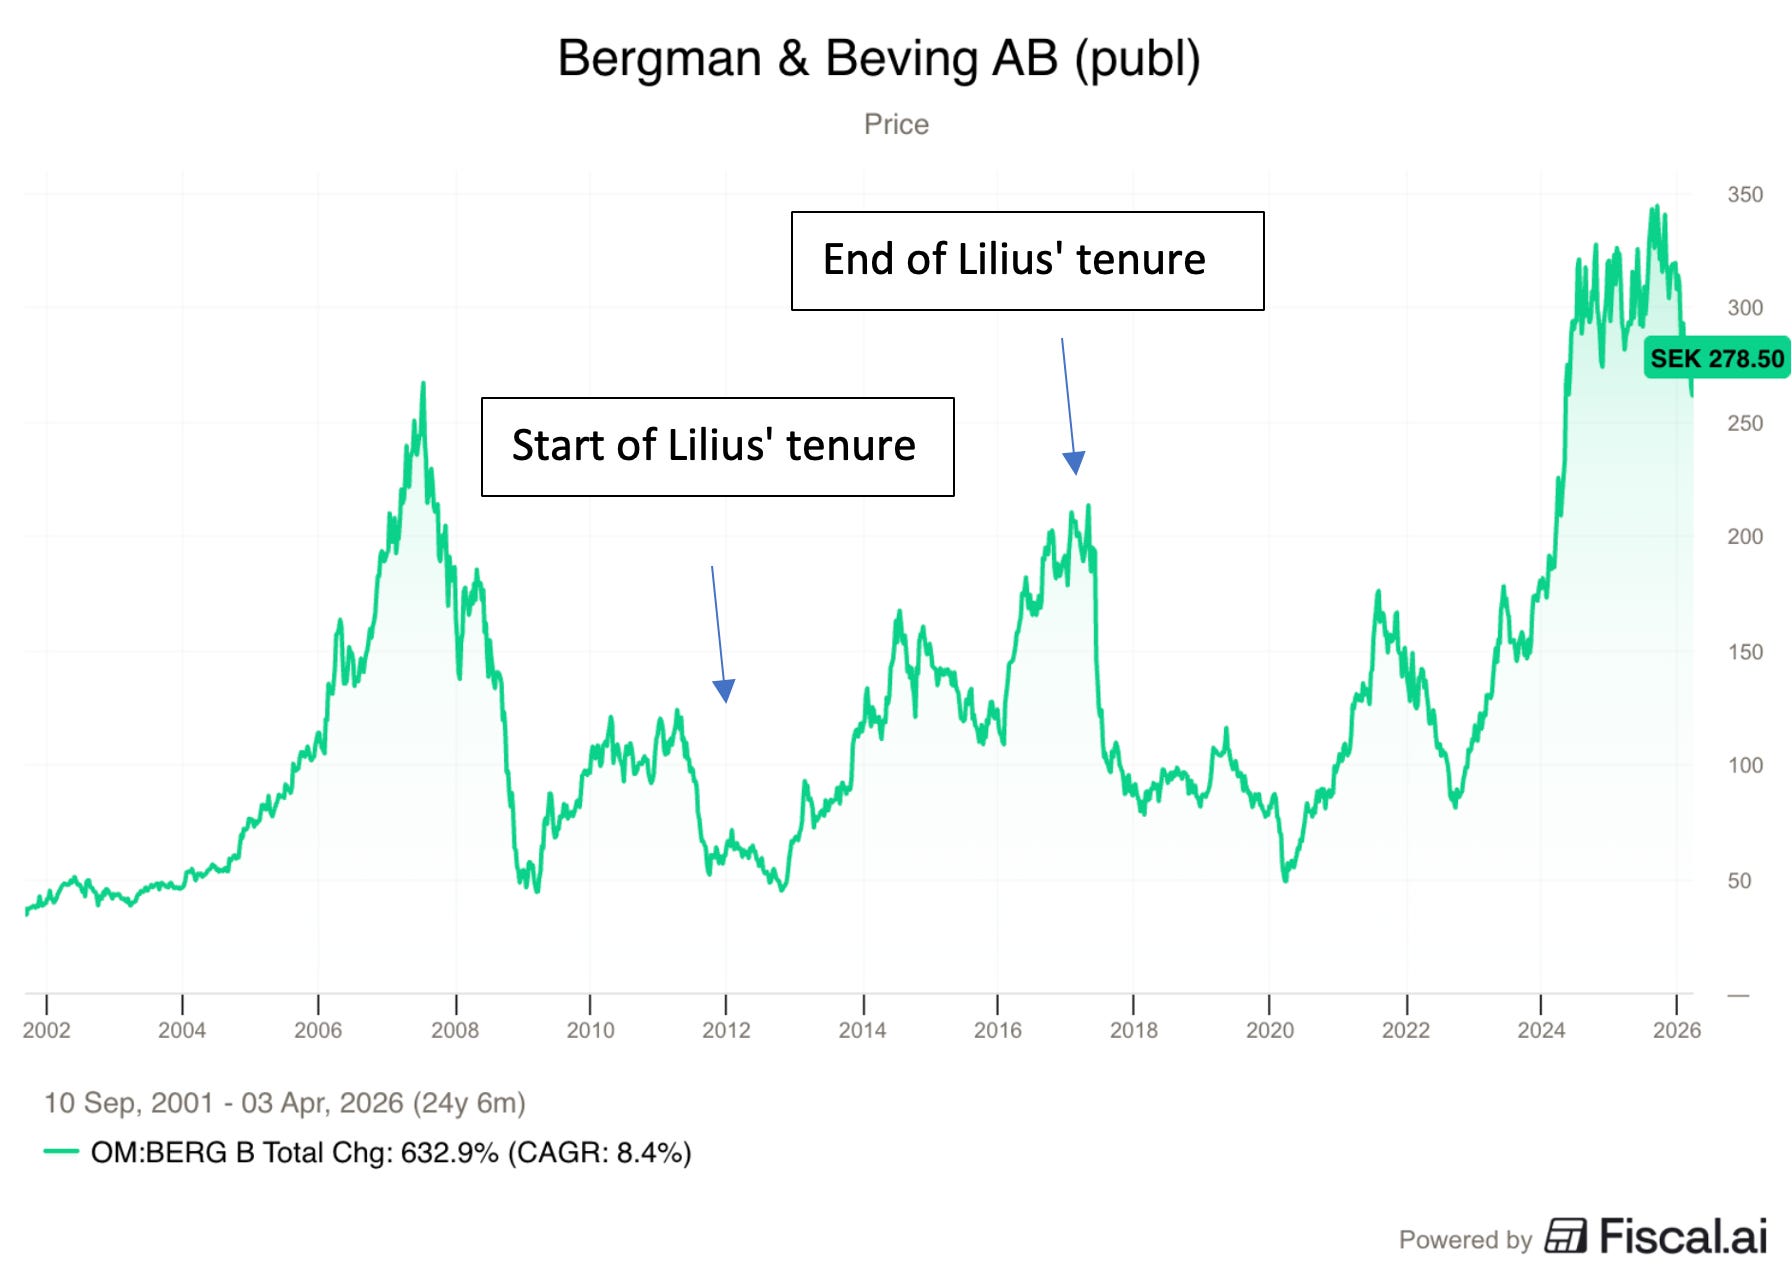
Lilius was CEO of Bergman & Beving between 2012 and 2017.
Before he was appointed CEO, the company was struggling due to a failed centralization experiment.
Bergman & Beving moved toward a more centralized approach to gain synergies and economies of scale.
But it failed miserably.
The Board decided to appoint Lilius, then the CEO of Bergman & Beving’s best-performing unit, to re-implement the decentralized approach.
And he did extremely well.
His tenure was one of the best periods ever for Bergman & Beving shareholders.
The stock made a return of over 40% per year:
2. Personality
It’s rare to find CEOs who prioritize shareholder returns over personal prestige.
Yet this is exactly what Lilius has demonstrated.
After doing an excellent job at Bergman & Beving, he chose to spin off Momentum Group 1.0.
Instead of remaining CEO of the larger parent company, Lilius stepped in as CEO of the smaller spinoff.
Just five years later, he repeated a similar move by spinning off Momentum Group 2.0.
And once again, he chose to lead the smaller entity. Personal prestige is clearly not his primary motivation.
Momentum’s CFO, Niklas Enmark, also brings deep experience from the Bergman & Beving ecosystem, including seven years as CFO at Lagercrantz.
Looking at the Board of Directors, there is also strong representation from the Bergman & Beving family.
The current Chairman also serves as Chairman of AddLife, while another director sits on the board of Lagercrantz.
Momentum appears to favor board members with extensive experience within the Bergman & Beving group.
Shareholder base
Next to interesting managers and directors, Momentum also has some high-quality shareholders.
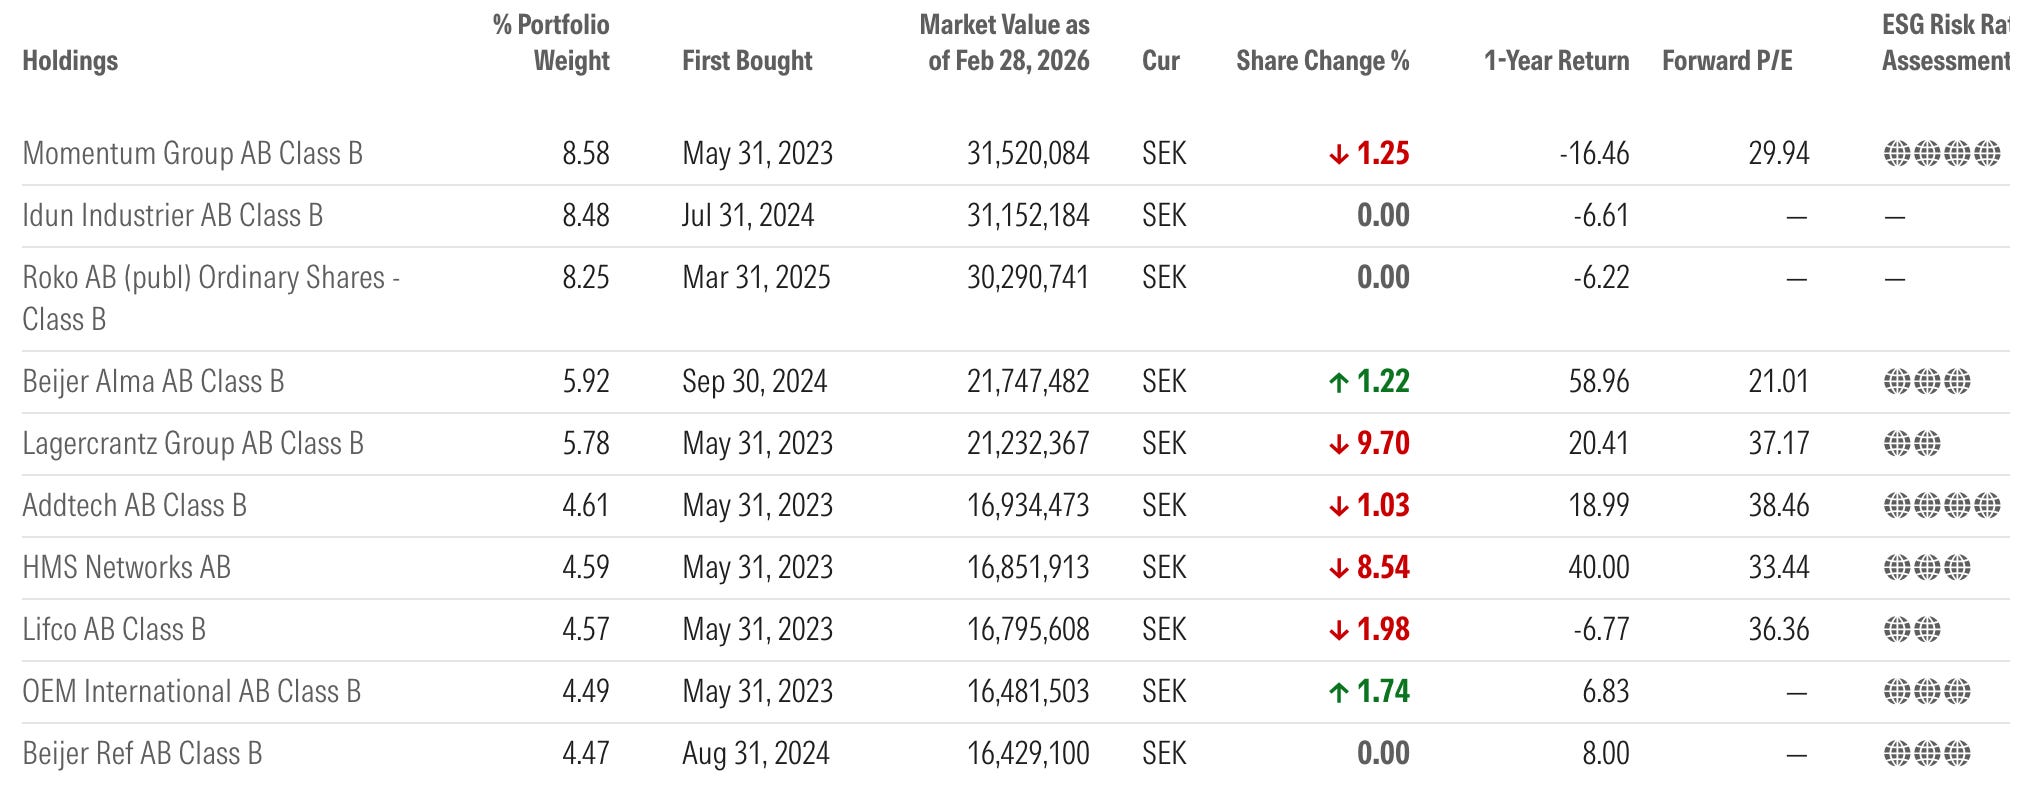
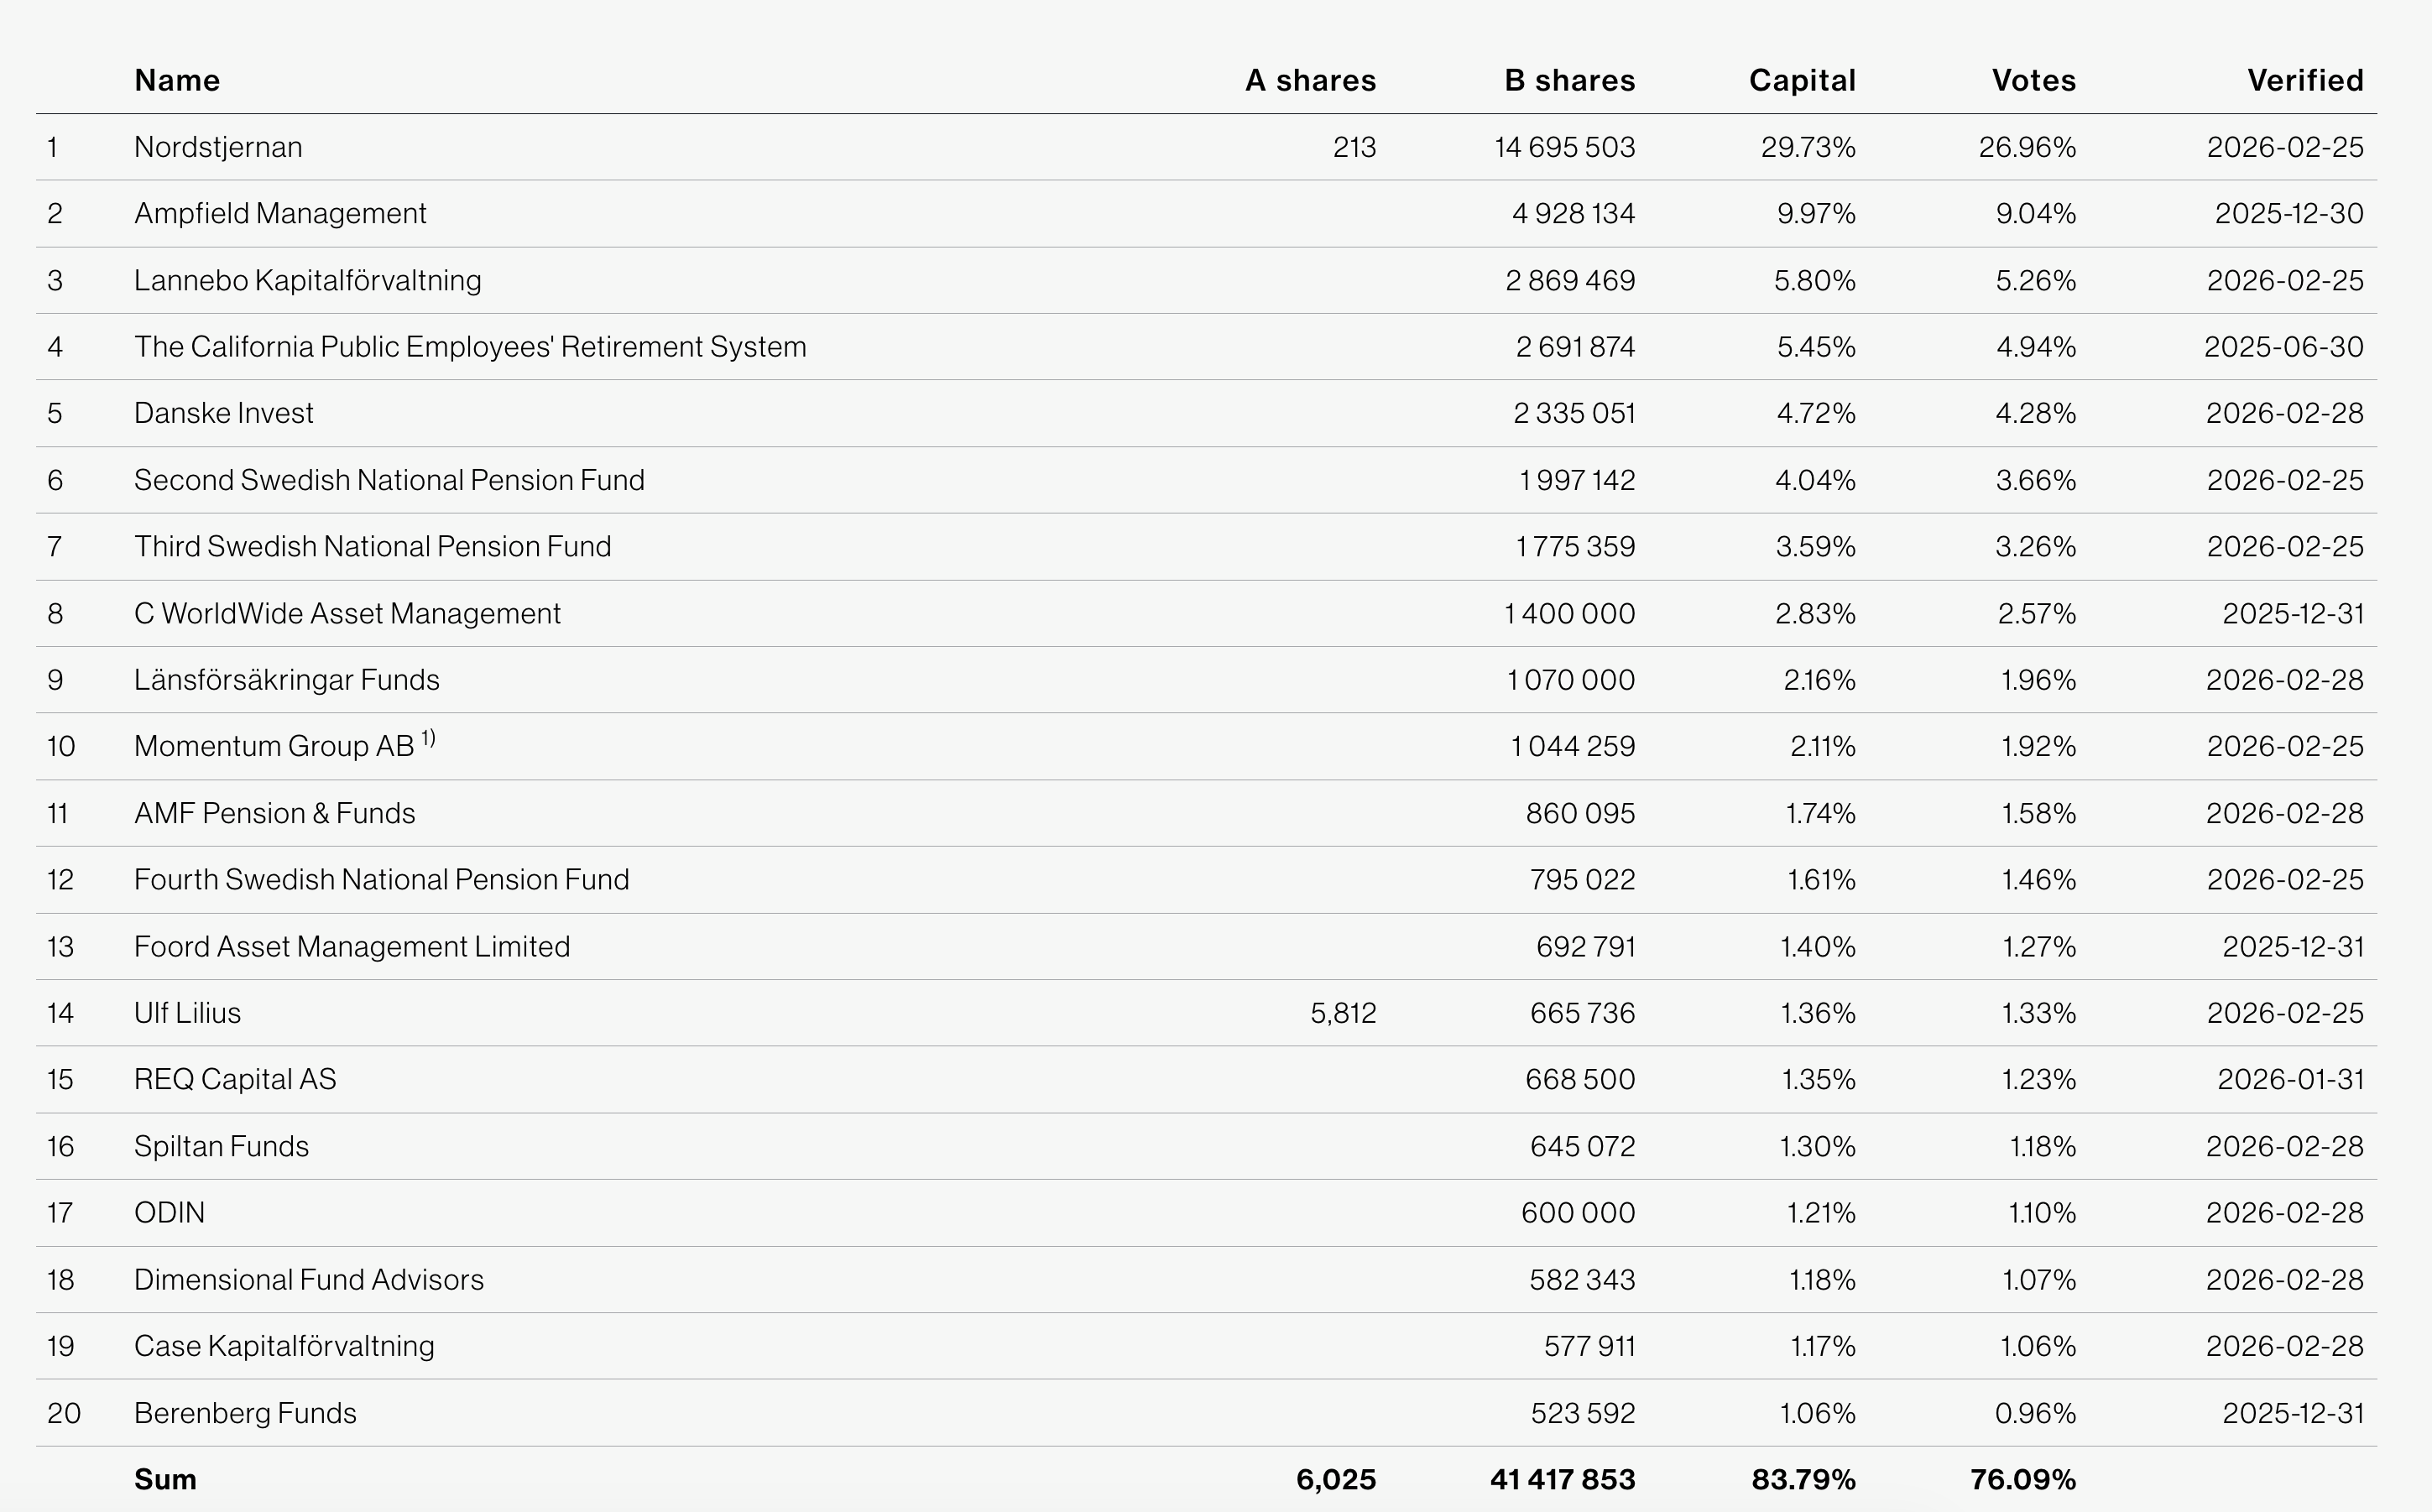
The most notable shareholder is REQ Capital.
REQ is a fund that specializes in serial acquirers.
They are extremely knowledgeable about this subject and run two serial acquirer funds: REQ Global Compounders and REQ Nordic Compounders.
According to Morningstar, Momentum Group is currently their largest holding in the REQ Nordic Compounders Fund.
This is a strong signal.
Three of their fund managers have recently published an excellent book called ‘The Compounders’, which tells the story of 9 successful serial acquirers in depth.
In the past, they also wrote a phenomenal deep dive on serial acquirers that you can find here: Acquisition Driven Compounders.
In its 2024 Investor Letter, REQ went a bit deeper into why they are invested in Momentum.
The summary of their thesis is the following:
“Finding the unique combination of a strong business and a passionate, skilled leadership team is rare. You find this combination in Momentum Group. Ulf Lilius, the CEO, having spent nearly his entire career within the company, knows its inner workings.” - 2024 REQ Investor Letter
The largest shareholder is Nordstjernan, which is a prominent Swedish family office.
3. Fundamentals
The two most important metrics for serial acquirers?
The Return on Invested Capital (ROIC)
The Reinvestment Rate
Multiply the ROIC (NOPAT/Invested Capital) by the Reinvestment Rate (Cash Acquisitions/Operating Cash Flow), and you have a level of compounding as a result.
You only compound at high rates if you both earn high returns (ROIC) and have the opportunity to keep reinvesting (Reinvestment Rate).
Let’s now look at these two metrics for Momentum Group AB ($MMGR) compared to other serial acquirers:
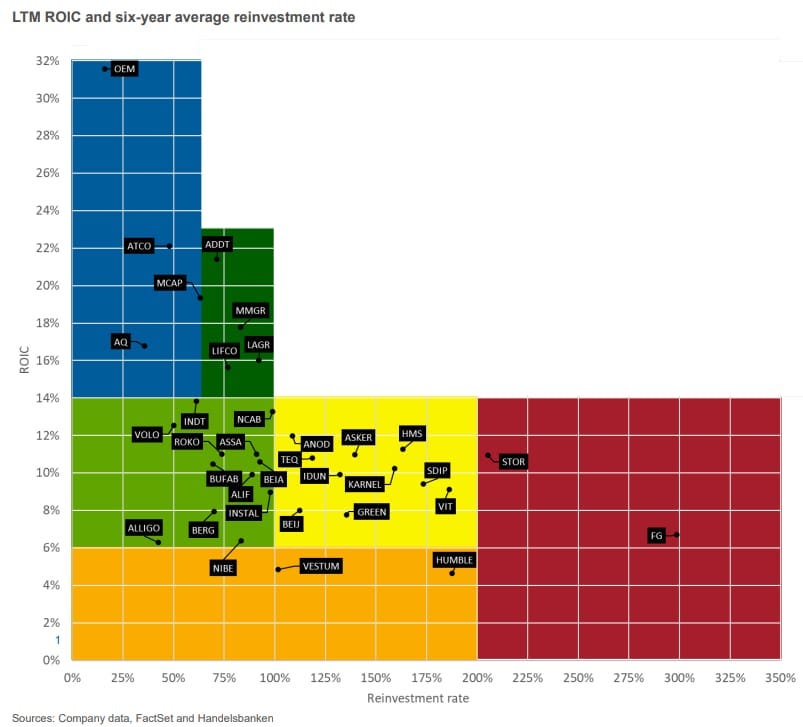
As you can see, Momentum scores very strongly on both dimensions with an ROIC of around 18% and an average reinvestment rate of +85%.
This gives you a rate of compounding of 15.3% (18%*85%).
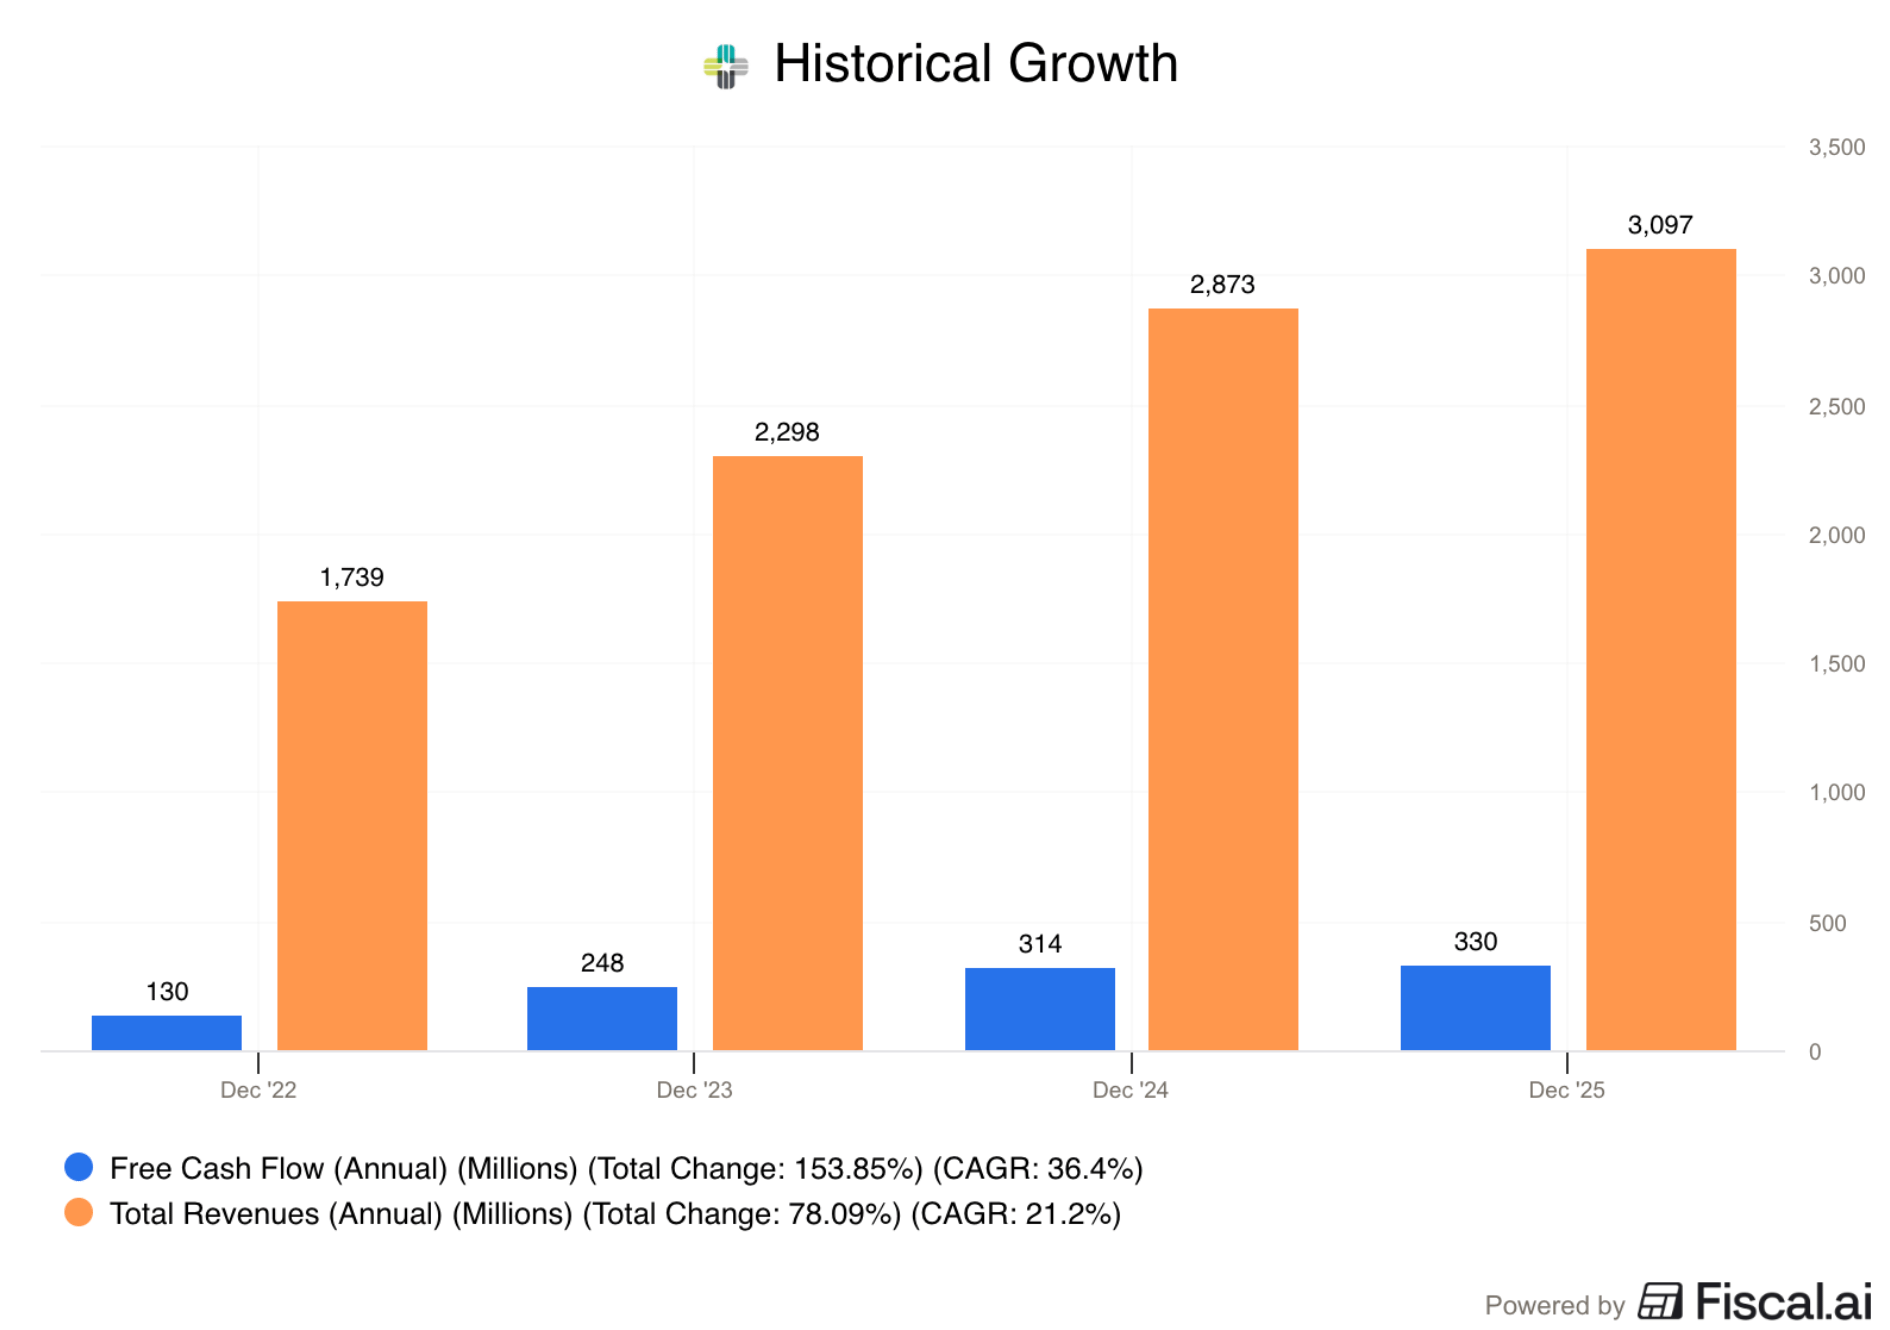
Interestingly, Momentum’s inside target is also to grow its intrinsic value by 15% per year.
So far, they have exceeded this target. Historical growth is higher than 15%:
With serial acquirers, it’s important to make a distinction between organic growth and acquired growth.
Ideally, you want serial acquirers where the organic growth is consistently above the inflation rate.
Below are the organic growth rates for Momentum:
2022: +10%
2023: +7%
2024: +3%
2025: -2%
Historically, Momentum’s average organic growth rate has been above inflation.
However, it’s also clear that organic growth is in a downward trend.
Is this something we should worry about? I don’t think so, as it’s not a Momentum-specific problem.
It’s a common pattern you see among the Swedish serial acquirers.
Finally, we want to avoid companies that carry heavy debt loads.
Momentum’s Net Debt/FCF stands at 1.7x.
This is well below our hurdle of 4x.
The less capital that is allocated towards repaying debt, the more capital that can be used to fund future acquisitions.
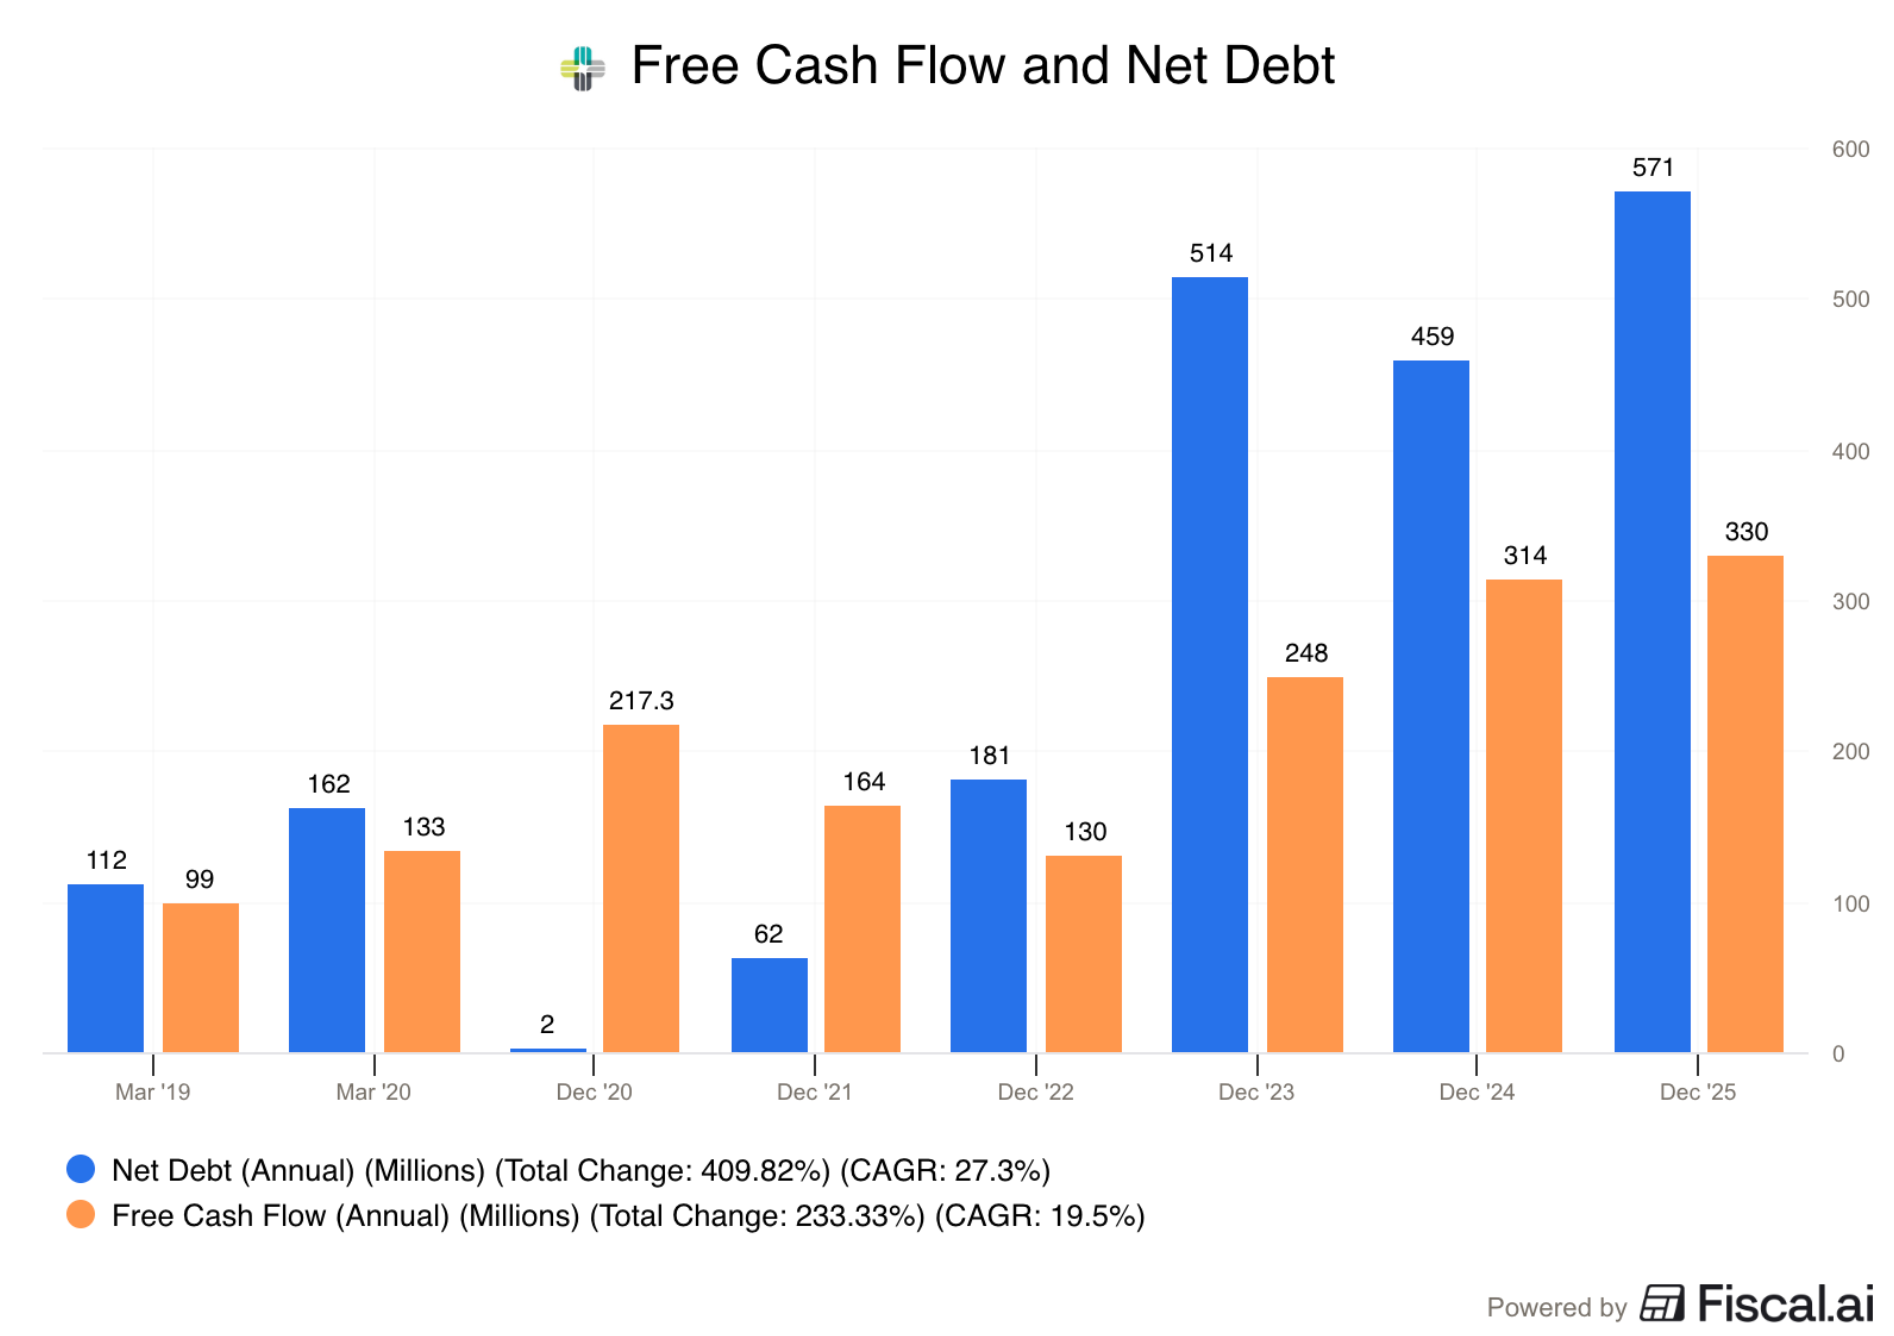
Besides the downward trend in organic growth, Momentum’s numbers look healthy.
4. Valuation
We always use three methods to value a company:
A comparison with historical valuation multiples
The Earnings Growth Model
A Reverse DCF
1. A comparison with historical valuation multiples
This method serves as a first checkup. It’s like checking the temperature of the water with your feet before diving in.
Most of the Swedish serial acquirers focus on EBITA as a metric for intrinsic value.
Why EBITA? There are two key reasons:
They know that depreciation is a real expense. That’s why they use EBITA instead of EBITDA.
Big amortization expenses (mainly from Goodwill related to acquisitions) are not a real economic cost.
Because of the amortization expenses, Net Income doesn’t reflect the true value creation.
This is why you must be careful if you want to use a Price-to-Earnings ratio (PE) to value Momentum Group or other Swedish acquirers.
The EV/EBITA of Momentum Group equals 21.1x.
2. The Earnings Growth Model
This model shows the yearly return you can expect as an investor.
In theory, it’s easy to calculate your expected return:
Expected return = EPS growth + Dividend Yield +/- PE Expansion (Contraction)
Because the P/E ratio and Earnings aren’t the best metrics for Momentum, we use different metrics here.
But the outcome is still the same: the return that you can expect as an investor.
Expected return = EBITA Per Share Growth + Dividend Yield +/- EV/EBITA Expansion (Contraction)
Here are the assumptions I use:
EBITA Per Share Growth = 15% per year over the next 5 years (in line with Momentum’s internal target)
Dividend Yield = 1.1%
EV/EBITA to decline from 21.1x to 17.5x over the next 5 years
Expected return = 15% + 1.1% + 0.2*((17.5x – 21.1x)/21.1x)) = 12.7%
A 12.7% return looks attractive.
Keep in mind that this valuation model is, of course, very sensitive to the intrinsic value growth of the business.
3. Reverse DCF
Charlie Munger once said that if you want to find the solution to a complex problem, you should invert. Always invert. Turn the problem upside down.
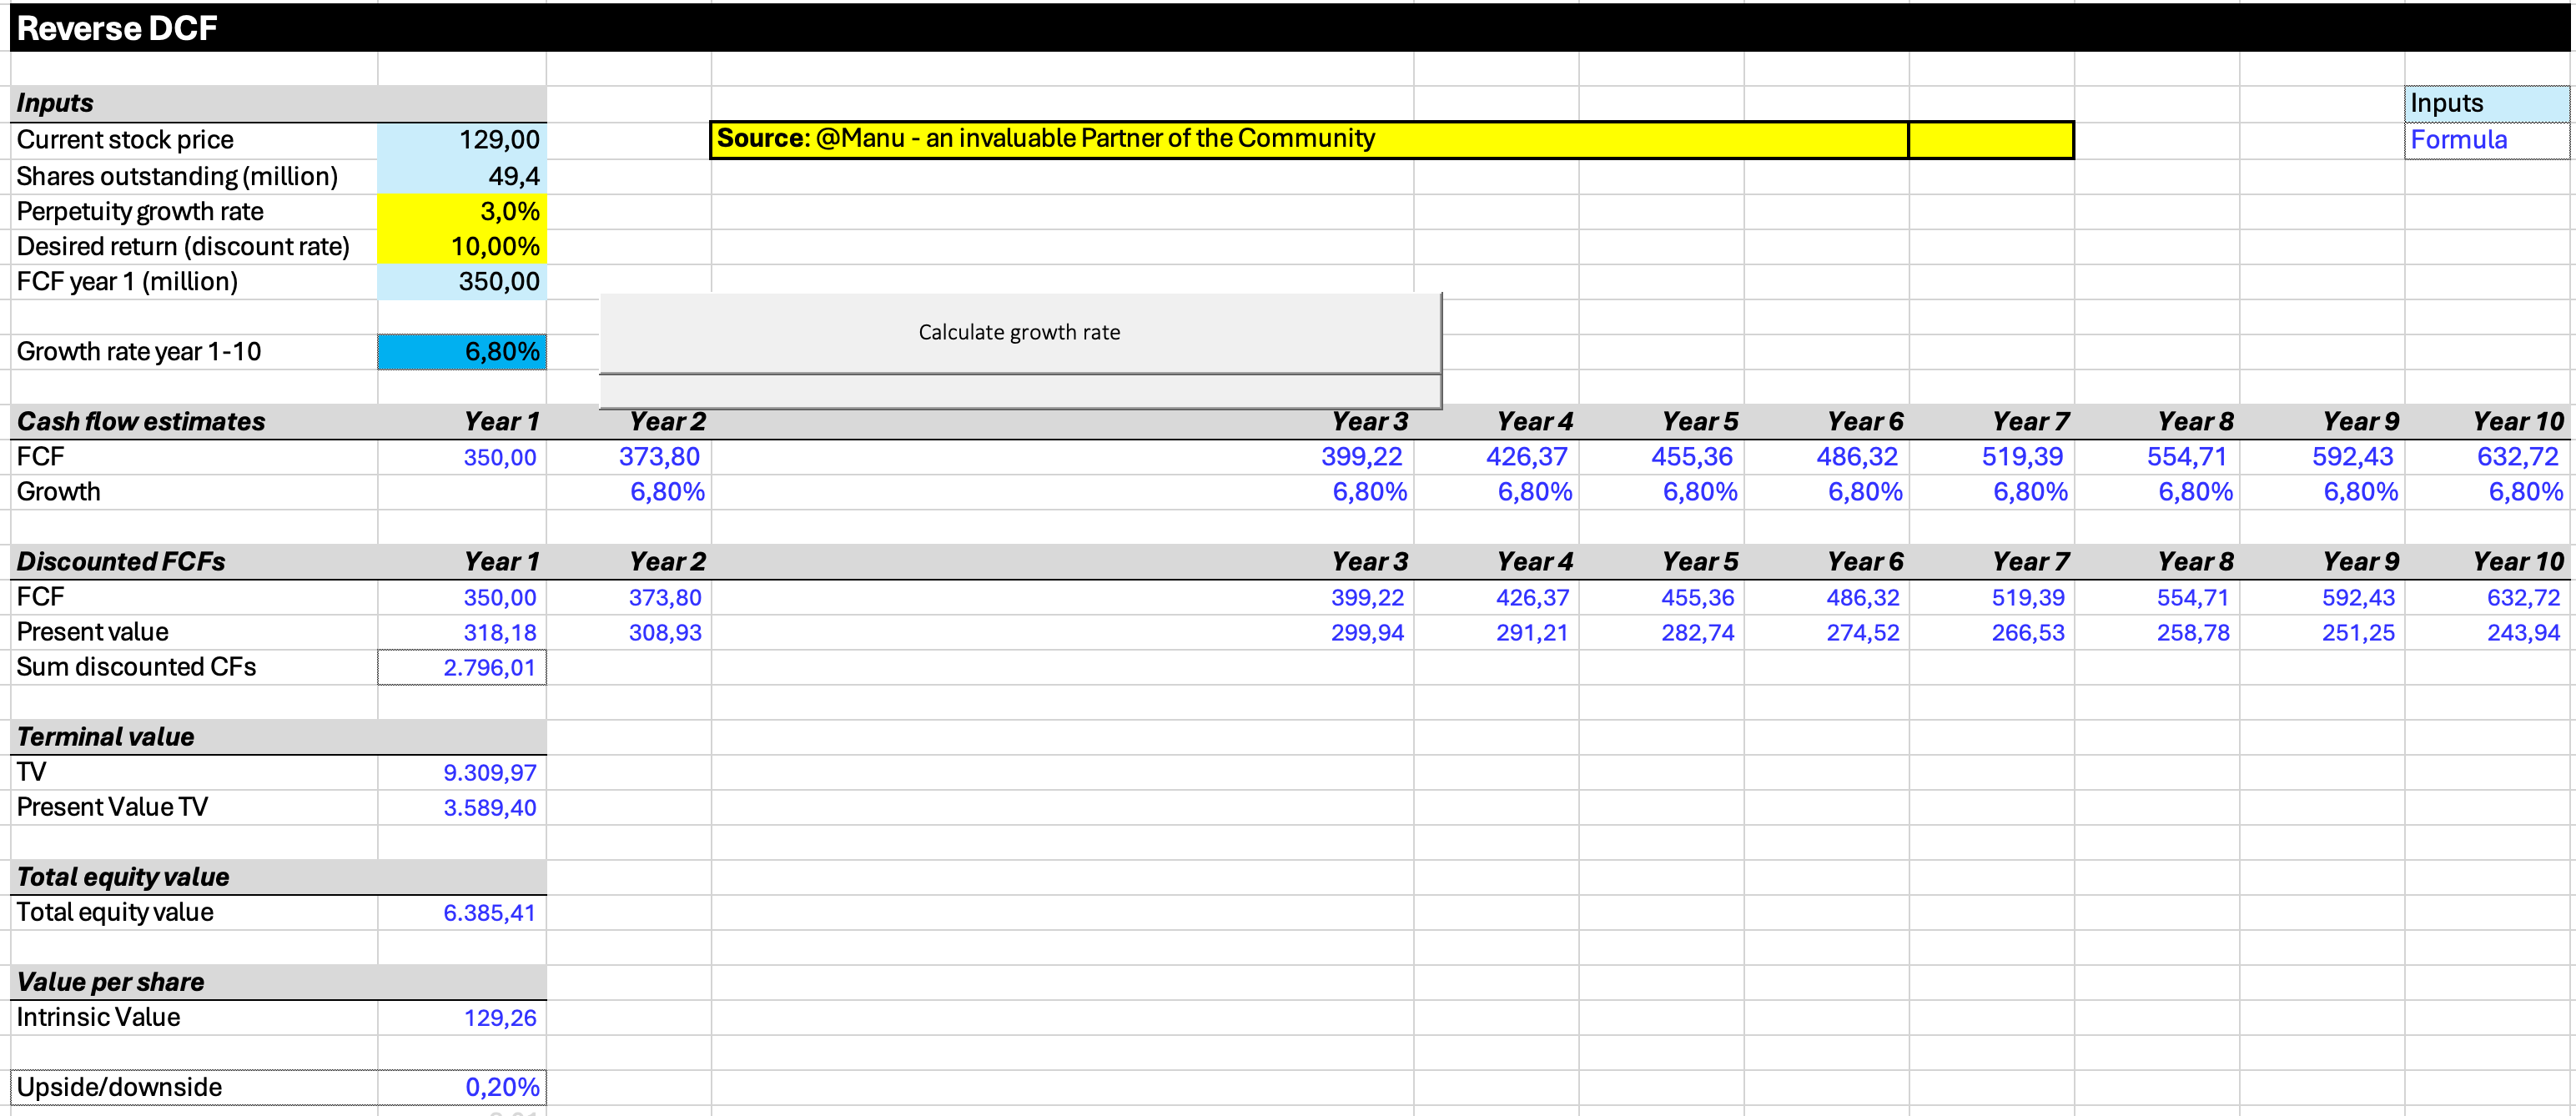
A reverse DCF shows you the expectations implied in the current stock price.
You try to determine for yourself whether these expectations are realistic.
A Free Cash Flow of SEK 350 million for 2026 looks conservative as a starting point.
For reference, Momentum’s FCF in 2O25 was SEK 330 million.
Using SEK 350 million, the reverse DCF indicates that Momentum should grow its FCF at 6.8% per year to yield an annual return of 10% for investors.
Given the phenomenal track record, this seems very realistic.
4. Valuation conclusion
Using these three tools, we can now make an overall conclusion regarding valuation.
Here is what it looks like:
EV/EBITA: 21.3x
Earnings Growth Model: 12.7% (Yearly return > 10%? ✅)
FCF-Growth Reverse DCF: 6.8% (Realistic growth expectations? ✅)
Momentum looks fairly valued.
5. Putting it together
Let’s go over the highlights of this Momentum Group pitch.
Is it an interesting stock to buy?
