
📈 Brookfield Deep Dive Part 3
Brookfield week part III

Brookfield is one of the best compounders you’ll ever see.
But is it still an interesting investment?
Let’s take a look at this high-quality business.

Brookfield Week
This is part III of our Deep Dive in Brookfield Corporation.
Did you miss the first two articles?
Brookfield
👔 Company name: Brookfield Corporation
✍ ISIN: CA11271J1075
🔎 Ticker: BN
📚 Type: Owner-Operator
📈 Stock Price: CAD 61
💵 Market cap: CAD 137 billion
📊 Average daily volume: CAD 135 million
1. Is the company a great capital allocator?
Capital allocation is the most important task of management. We want companies that put the money of shareholders to work at an attractive rate of return.
To understand this better, it helps to break capital allocation into its main parts:
Investments in the core business
Acquisitions
Dividends
Share buybacks
Investments in the core business
Normally, we approach this by looking at ROE and ROIC.
ROE (Return on Equity) tells you how much profit a company makes for every dollar of shareholder money.
Formula: Profits / Equity
ROIC (Return on Invested Capital) tells you how much profit a company earns for every dollar it has put to work.
Formula: Profits / Invested Capital.
For a ‘normal’ business these metrics show how efficiently the company uses its money to make even more money.
But Brookfield isn’t a normal business. It’s more like a collection of hundreds of companies.
As a result, ROE and ROIC aren’t the right metrics to assess the efficiency of Brookfield’s business.
In fact, they can be very misleading.
Here is why:
Brookfield’s profits aren’t ‘normal.’ A big part of Brookfield’s earnings comes from changes in the value of its assets (buildings, infrastructure, …) not from selling products or services. These are accounting gains, not cash profits. So, in one year, the profit might look huge, and the next year tiny, even if the business itself didn’t really change. The numerator is unreliable.
Their balance sheet is very complex. Brookfield owns some assets directly, and others together with investors. Because of that, it’s hard to know exactly how much capital truly belongs to Brookfield itself. The ROE-denominator is unreliable.
They buy and sell assets all the time. Brookfield constantly recycles capital: it sells mature assets and reinvests in new projects. This means the amount of invested capital changes every few months. The ROIC-denominator is unreliable.

In other words: Brookfield is an investment engine, always buying, selling, and reinvesting to compound value over decades. To judge how well they allocate capital, we should ask:
Are they growing value per share?
Brookfield aims for a 15%+ IRR (Internal Rate of Return) on new capital. Are they delivering on that goal?
To answer the first question, we would normally look at the book value per share.
Book value shows what a company’s assets are worth on paper after subtracting its debts.
But Brookfield wouldn’t be Brookfield if it were that simple.
The company uses a broader measure called Intrinsic Value per Share (or Plan Value per Share in its presentations).
This measure doesn’t just count what’s in the books, it also adds Brookfield’s own estimate of what its businesses are really worth, including private assets and long-term projects.
In the 2024 annual report, Brookfield said its Intrinsic Value per Share rose by about 19%, from $85 to $100 per share in one year.
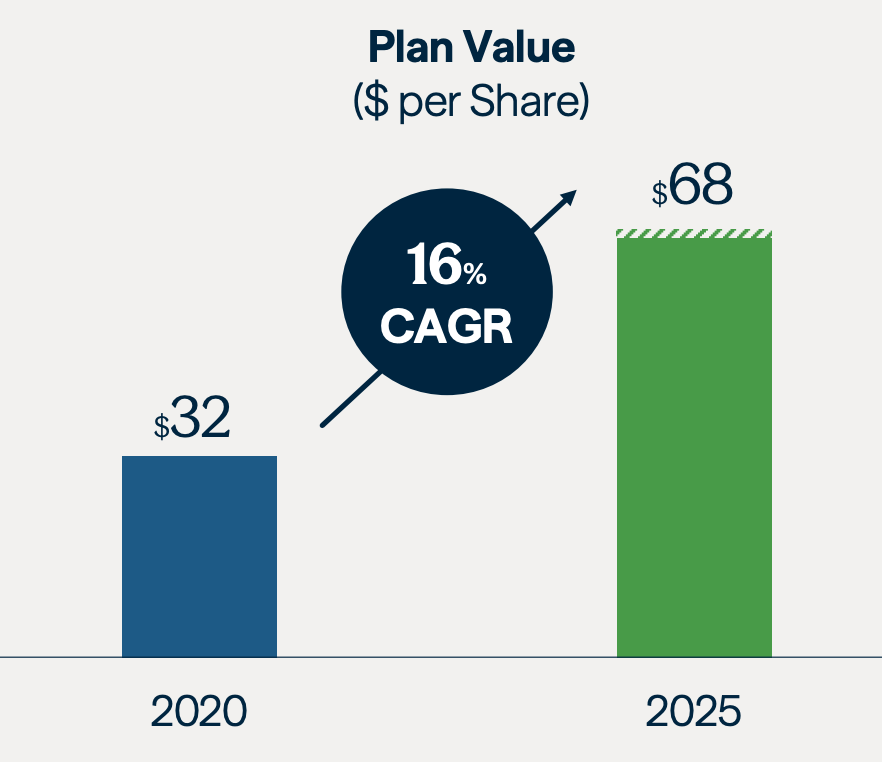
In the 2025 Investor Day presentation, management showed that its Plan Value per Share grew from $48 in 2020 to $102 in 2025.
That’s a 16% average annual increase over five years.
In short: Brookfield is clearly growing value per share. This proves that Brookfield’s capital allocation decisions are paying off.
Let’s move to the second question: Is Brookfield really achieving its 15% IRR goal?
First, what is IRR?
The IRR or Internal Return Rate is a way to measure how much money Brookfield earns on every new dollar it invests.
Imagine you invest one dollar today. How much money does it bring you back each year until you get all your money back?
For example, if you invest $100 and receive $15 back after one year, that’s a 15% IRR. You earned 15% on your money.
That’s easy.
But say you invest $100 in a project that pays you $10 every year and then you sell it for $120 after five years, your total return: $10 + $10 + $10 + $10 + $10 (yearly profits) + $120 (sale) = $170.
So, a 17% IRR? No, because that money comes bit by bit over five years. The IRR turns that into an average annual return. In this case, around 13%.
As you can see, the IRR perfectly shows how efficiently Brookfield puts its money to work.
The higher the IRR, the smarter the investment.
Brookfield’s goal is to earn at least 15% per year on the money it invests.
That means for every $100 million invested, they want to create $115 million of value after one year (and then compound that year after year).
Looking at the 2024 annual report, the numbers show that Brookfield is clearly meeting, and even exceeding its 15% target:
In its real estate business, Brookfield earned an impressive 29% IRR
In renewable power, the company achieved a 25% IRR
In infrastructure, Brookfield realized an IRR of 17%
These transactions confirm that Brookfield’s capital allocation strategy works.
However, we don’t see the IRR for Brookfield Asset Management (BAM) and Wealth Solutions.
That’s because performance in these parts of the business is measured differently because these divisions don’t manage real assets. Instead, they manage money for clients or invest their own capital, mainly the insurance float.
So rather than tracking how much profit one project makes, Brookfield measures how much cash these divisions generate each year compared to the capital they use.
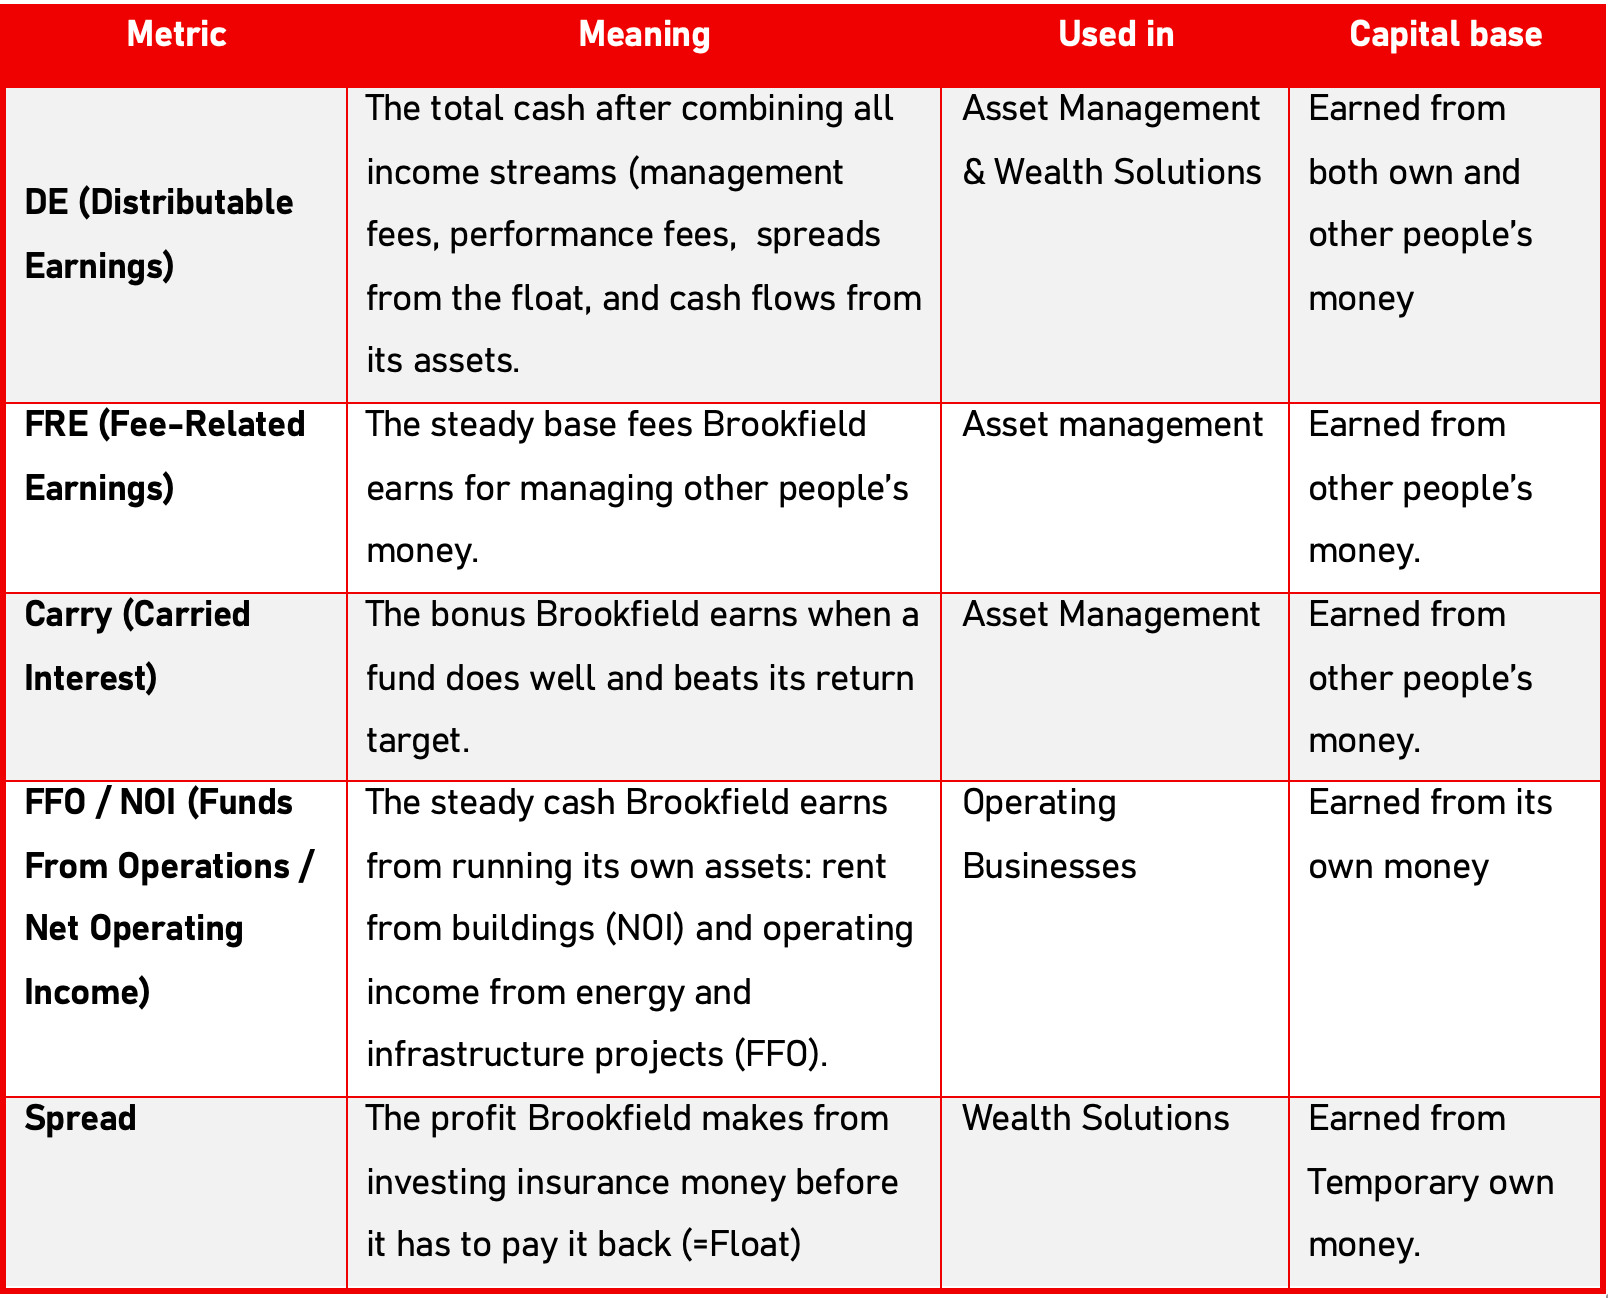
Brookfield Asset Management (BAM) focuses on Distributable Earnings (DE), the cash it earns every year from managing money for its clients. In 2024, BAM generated about $2.1 billion in DE, up more than 20% from the previous year.
Wealth Solutions (Brookfield’s insurance arm) is measured by Distributable Operating Earnings (DOE). It shows how much profit Brookfield earns from investing its insurance float, the money it holds from policyholders before paying out claims. In 2024, Wealth Solutions earned about $1.35 billion in DOE, equal to roughly a 15% return, right in line with Brookfield’s long-term goal.
These results show that Brookfield’s capital allocation also works in its non-asset businesses.
Together, Intrinsic Value per Share and IRR (or DE and DOE) show how effectively Brookfield allocates its capital.
In simple words:
IRR is the input. It shows how well Brookfield puts its money to work.
The growth in Intrinsic Value per Share is the output. It shows what those investments produce over time.
Acquisitions
For a good understanding, we first need to make a clear distinction between Brookfield’s three main parts.
Brookfield Asset Management (BAM) and Wealth Solutions don’t really make acquisitions.
BAM earns money by managing investments for clients, and Wealth Solutions invests the insurance float, they don’t go out and buy companies or real assets.
But for Brookfield’s operating businesses, acquisitions are at the heart of the model.
This is where Brookfield uses its capital to buy, build, and improve real assets (buildings, infrastructure, …) and later sells them at a profit.
So, they don’t buy assets just get bigger. They buy and sell to recycle capital.
Recycling capital simply means selling something that’s gone up in value and using that money to buy something new that can grow again.
This way, the same money keeps working again and again, creating more value each time it’s recycled, without needing new money from outside investors.
Let’s take a look at the numbers.
In its annual Report 2024 Brookfield says it sold nearly $40 billion of assets.
At the same time Brookfield doesn’t give an exact number for how much it spent on new acquisitions.
The reason is, again, the very complex structure of the company.
Here’s a simple example to explain:
Imagine Brookfield sells an office tower for $1 billion. That money goes back to Brookfield (recycled capital).

At the same time, Brookfield also manages money for other investors, like pension funds or insurance companies.

Those investors give Brookfield another $5 billion to put into new projects. So, Brookfield can now invest $6 billion in total, even though only $1 billion came from its own sale.

Now imagine that Brookfield invests that $6 billion in three new assets:
- a data center worth $2 billion,
- a renewable power project worth $3 billion,
- an infrastructure platform worth $1 billion.

Now, here’s the tricky part.

Each of those investments might be owned by different Brookfield subsidiaries and funds.

For example:
- The data center might be 20% owned by Brookfield itself and 80% by a Canadian pension fund.
- The renewable project could be owned through a joint venture with one of Brookfield’s renewable funds.
- The infrastructure platform might sit partly inside a private fund and partly on Brookfield’s own balance sheet.

So, $6 billion is invested, but only $1 billion of that money actually belongs to Brookfield. The rest belongs to outside investors.

Now imagine trying to add all those deals together across hundreds of assets, in dozens of funds, all around the world.

It would be almost impossible to calculate clearly, and it would change every time a partner adds or withdraws money.

That’s why the annual report doesn’t show one big number like:
‘Brookfield spent $X billion on acquisitions this year.’

Instead, it focuses on the IRR as it shows how well each investment turns money into more money, year after year.
So, the goal of these acquisitions isn’t just to grow in size. It’s to keep the money working.
Dividends
Brookfield’s dividend yield is only 0.5% even though the payout ratio is around 75%.
This may sound strange at first, but by now it should be clear that Brookfield is not a normal company.
Normally, a payout ratio is based on net income. In chapter 9 we explain why this doesn’t work well for Brookfield.
Instead, Brookfield uses Distributable Earnings (DE) instead. That’s the real cash profit left after paying all costs, interest, and taxes.
So, this is the cash that can be paid to shareholders or reinvested.
In 2024, Brookfield reported $6.3 billion in total DE and paid $1.1 billion in dividends.
That’s a payout ratio of only 17%.
So where does that 75% come from?
The $6.3 billion is what the entire Brookfield group earned in cash, including all the money made by its many funds and business partners.
But not all that money belongs to Brookfield itself.
Brookfield works together with big investors like pension funds and insurance companies. Most of the money from those investments goes to these partners, not to Brookfield.
But Brookfield still earns money by managing this external money (Asset Management). As explained above, it also invests its insurance float (Wealth Solutions) and collects steady cash from real assets (Operating Businesses).
Altogether, this brings in about $1.5 billion for Brookfield Corporation.
From that $1.5 billion, the company paid $1.1 billion in dividends, which is a payout of 75%.
At first, that may sound weak.
Brookfield keeps only $1.5 billion out of $6.3 billion and then pays most of it out as dividends.
But Brookfield’s model is different.
It controls and grows huge amounts of money for others. Most of the cash stays inside its funds and businesses, where it keeps working and growing.
Brookfield only takes a small piece each year to reward shareholders while the rest of the machine keeps compounding in the background.
Remember, this is what Brookfield calls recycling capital.
In short, Brookfield’s power doesn’t come from how much money it keeps; it comes from how much money it manages and how efficiently it makes that money grow.
Share buybacks.
Brookfield has a share buyback program from May 27, 2025, to May 26, 2026, to repurchase up to 143 million shares*, which is about 10% of its free float.
At today’s share price, that would be worth more than $8.5 billion if the full program were used.
In its annual Report 2024. Brookfield said it repurchased about 26.7 million shares (2024), good for roughly $1 billion, compared to 54.5 million shares in 2023.
That’s roughly 2% of all shares outstanding.
This means the total payout to shareholders is actually well above 100%.
Brookfield returned about $2.1 billion in 2024:
$1.1 billion in dividends
Roughly $1.0 billion in buybacks
While only around $1.5 billion of the group’s Distributable Earnings belonged to Brookfield itself.
For a normal company this would be a problem, but Brookfield’s isn’t a normal company.
Brookfield keeps recycling capital, and it earns steady fees from money it manages for others.
Because of this, it can pay out more cash to shareholders than it earns for itself, while the rest of the business keeps growing in the background.
*In October 2024, Brookfield did a 3-for-2 stock split, meaning every 2 shares became 3. The total value didn’t change, but there are now 50% more shares. Because of this, the number of shares Brookfield can buy back under its program also increases by 50%, while the total percentage (10% of the float) stays the same.
2. How profitable is the company?
Just like revenue, Net Income is not a good measure for Brookfield.
It moves up and down because:
Brookfield must include 100% of profits (and losses) of businesses it controls, even if it only owns part of them. For example, if Brookfield owns 60% of a wind farm, it must still report 100% of that farm’s profit and later subtract of the 40% that belongs to others.
Accounting rules force Brookfield to include paper gains or losses, even if no real cash comes in or out. For example, if the value of a building they own goes up on paper, Brookfield must show a profit, even though the building is not sold and no cash is received.
This makes Net Income look noisy and disconnected from the steady cash Brookfield actually generates.
This is why Brookfield reports other measures like, Distributable Earnings (DE), Fee-Related Earnings (FRE), Carried Interest (Carry), Funds From Operations (FFO) and Spread.
Sound complex?
Don’t worry, we’ll explain each metric in a minute, but first it is essential to know that Brookfield makes money in two ways.
On its own money: This is the money Brookfield invests itself. Its own capital which is reported as Common Equity. It shows how much of Brookfield’s own money is in each business and how much cash it earns from it.
On other people’s money: Brookfield also manages huge amounts for clients like pension funds and insurance companies. This money doesn’t belong to Brookfield, but Brookfield earns stable fees and bonuses for managing it well. This is what makes Brookfield such a powerful compounding machine.
We’ll look at how and how much money Brookfield makes, both on its own money (Common Equity) and on other people’s money (Client Capital) explained through its three main business lines: Operating Businesses, Asset Management, and Wealth Solutions.
But first, let’s take a closer look at the metrics Brookfield uses to measure this.
Now that we understand the main metrics and how Brookfield makes its money,
let’s look how profitable each side of the business really is.

Continue reading this post for free, courtesy of Compounding Quality.
 | A guest post by
|