

The recommendation of Warren Buffett?
Most investors are better off buying the S&P 500.
But not every company in the S&P 500 is a good investment.
Let’s teach you how you can share the good from the bad.
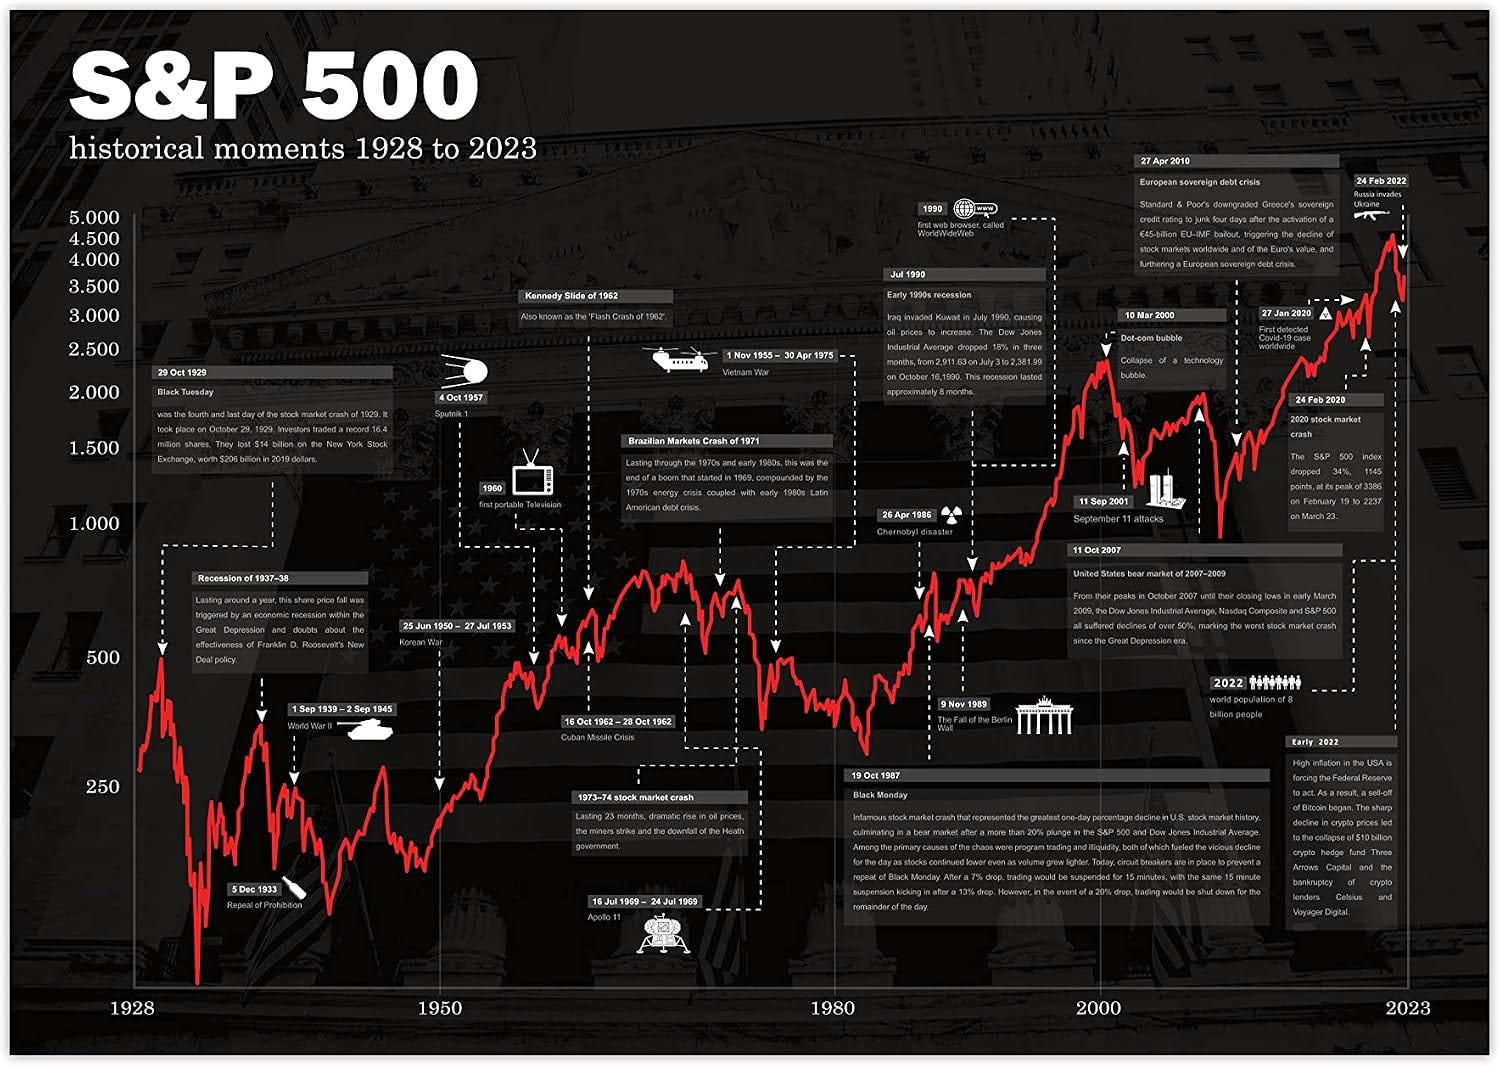
Only a few stocks matter
The S&P 500 has delivered an average annual return of 10% over the long term:
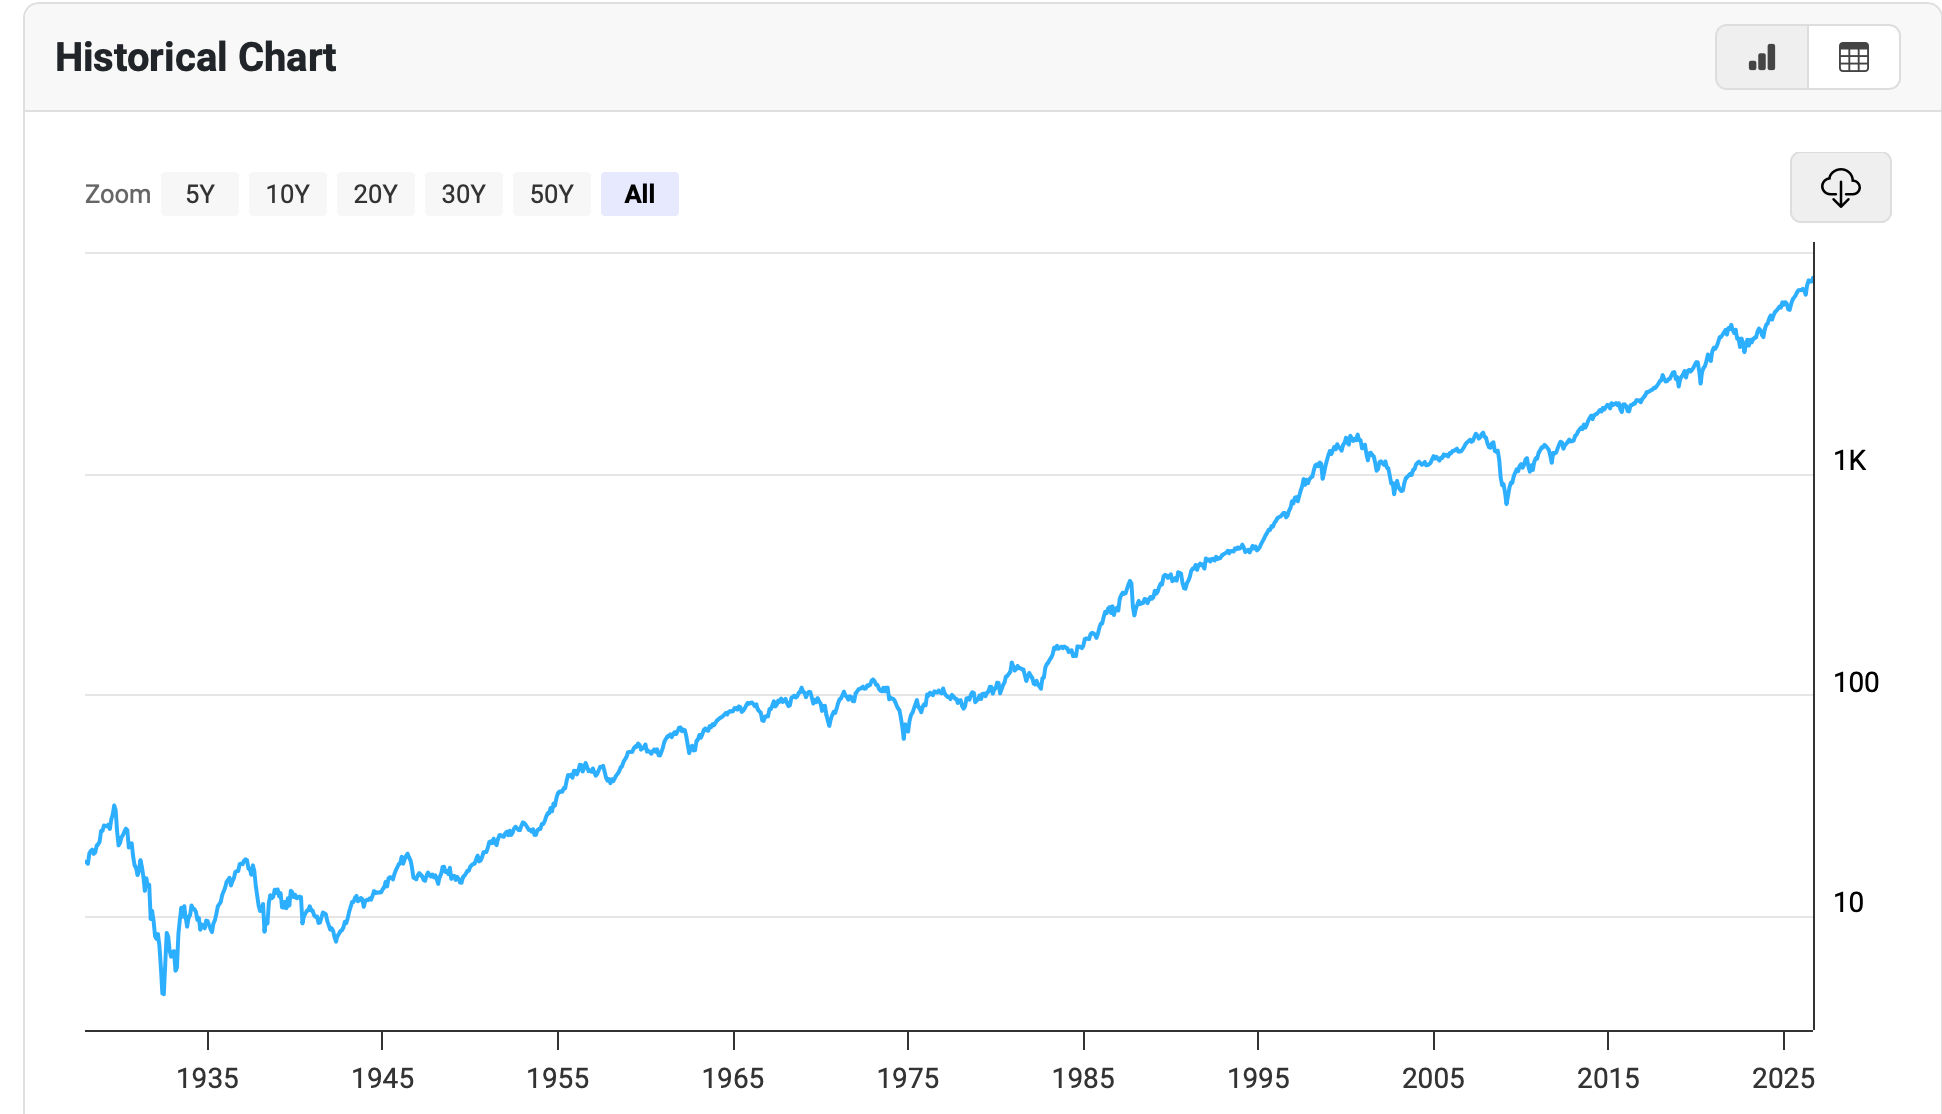
But you know what’s interesting?
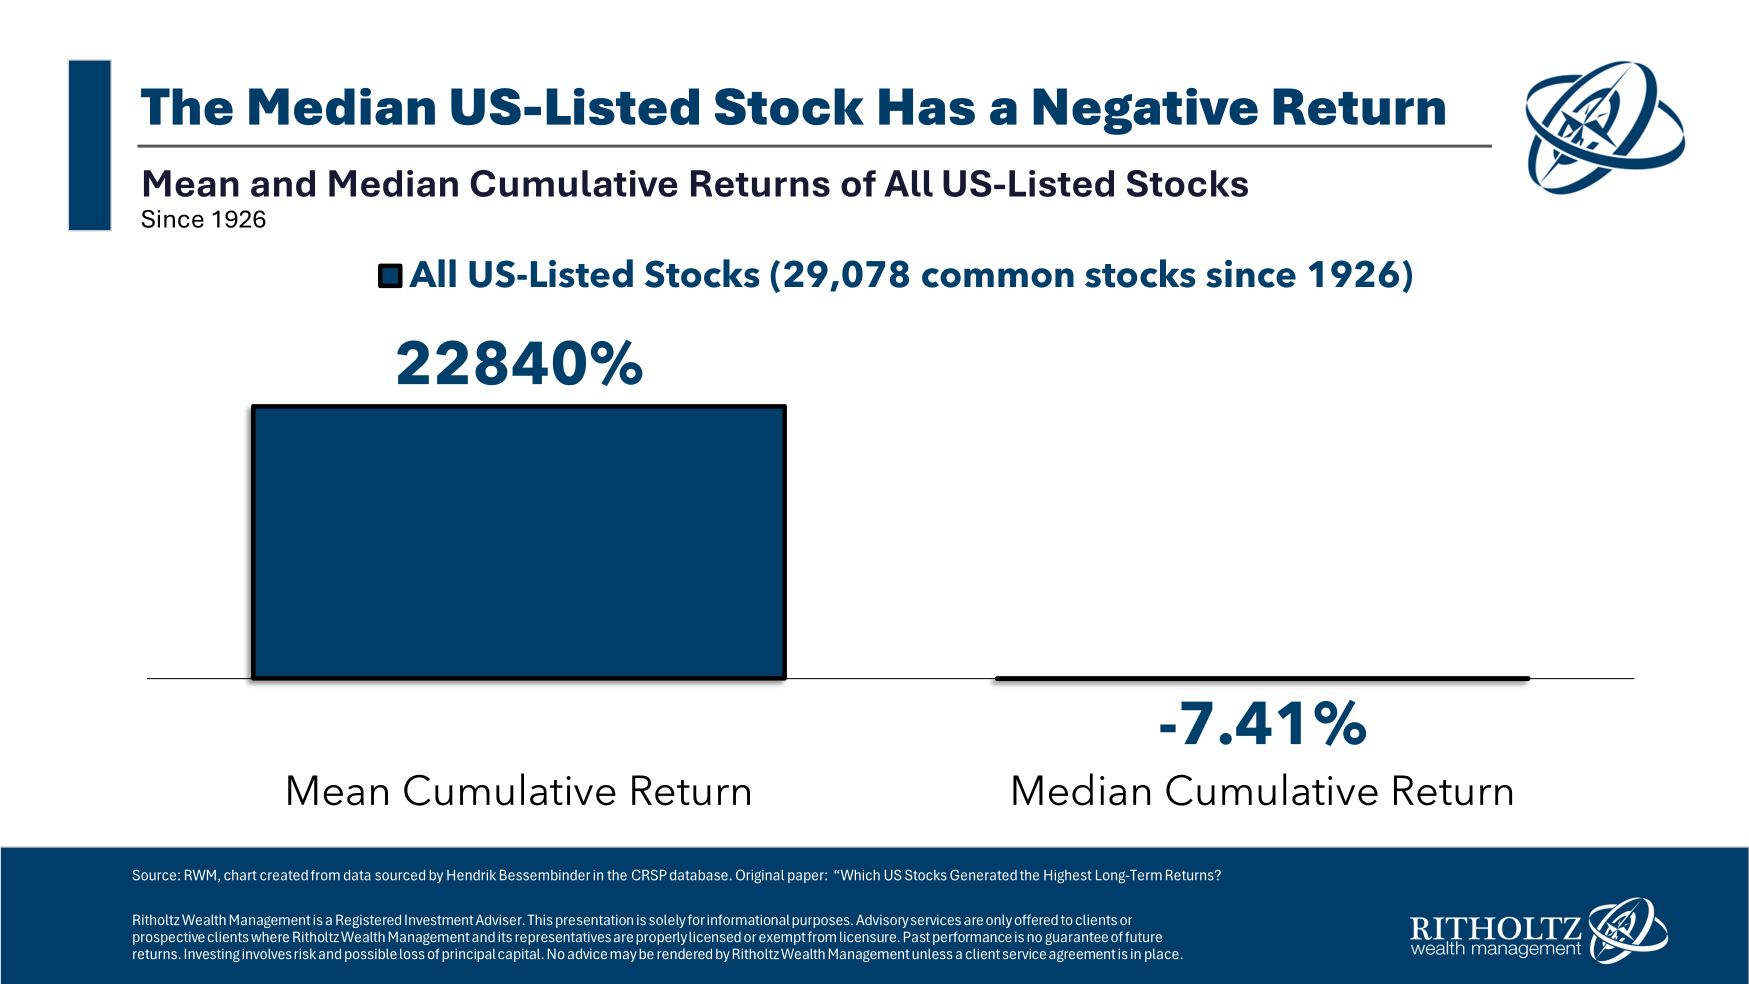
Hendrick Bessembinder looked at nearly 100 years of stock returns.
Here’s what he found:
The average cumulative return was +22,840%
The median cumulative return was -7.41%
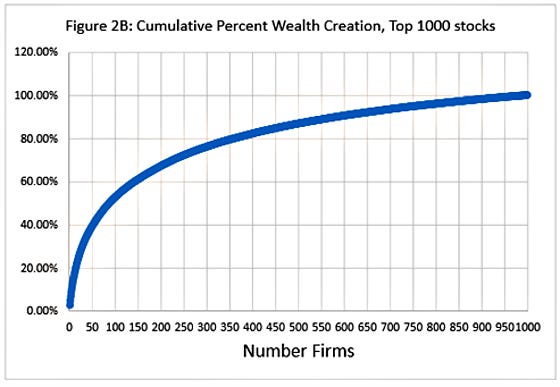
How can this be?
Because a very small number of stocks generate almost all market returns:
Buying a standard market-cap weighted index like the S&P 500 means you buy everything.
You get the highly profitable compounders, but you’re also buying the companies destroying capital.
As Quality Investors, we only want the best of the best.
What is quality?
You can define quality in several ways.
But there are a few general ideas that most of them have in common.
High reinvestment
In the long run, a stock is a slave to its business.
Not to sentiment. Not to macro. Not to the news cycle.
Eventually, a stock will always follow the fundamentals of the business.
That’s why you want to buy companies that can reinvest their own capital at high rates of return.
Here’s what Charlie Munger has to say about this topic:
"Over the long term, it's hard for a stock to earn a much better return than the business which underlies it earns. If the business earns 6% on capital over 40 years and you hold it for that 40 years, you're not going to make much different than a 6% return—even if you originally buy it at a huge discount. Conversely, if a business earns 18% on capital over 20 or 30 years, even if you pay an expensive looking price, you'll end up with a fine result."
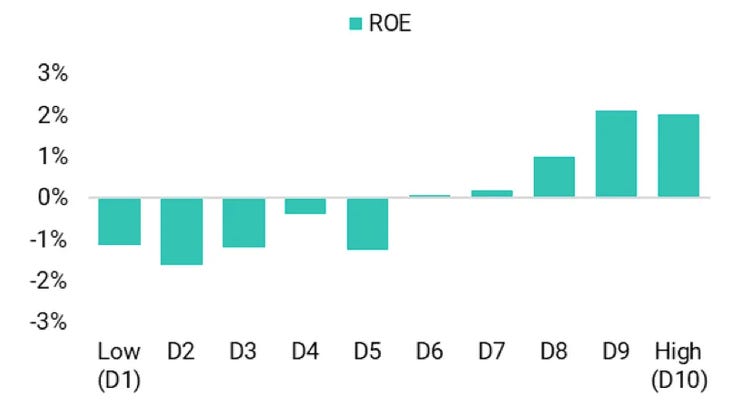
As you can see in this chart, the companies with the highest Return On Equity (ROE) generate the highest returns:
Low leverage
You want to own companies for a long time.
Let compounding do the heavy lifting for you.
As a result, you want to invest in companies that can survive for a very long time.
One thing that can hurt a business faster than almost anything else?
Too much debt.
Let’s turn to Charlie Munger for some more wisdom:
“There are only three ways a smart person can go broke: ladies, liquor, and leverage.”
When times are good, too much debt eats into your profits because you have to pay a lot of interest.
But when there’s a recession, rates go up, or credit tightens, too much debt can bankrupt a company (and wipe out equity investors like us).
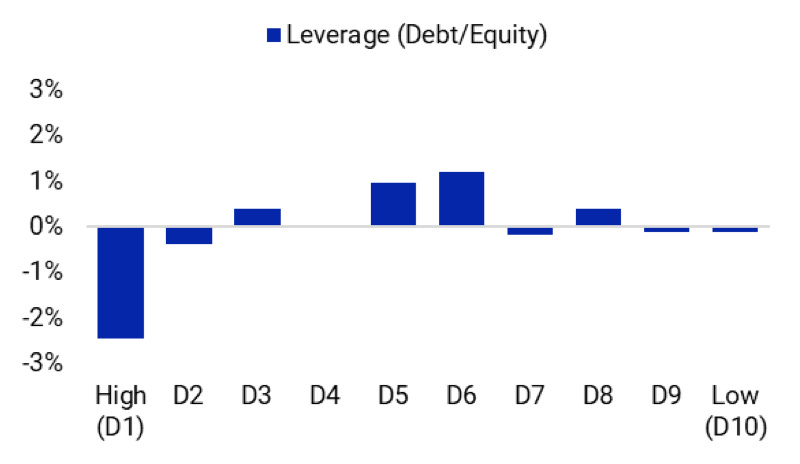
As you can see in this chart, having little debt doesn’t necessarily boost your returns. But having too much debt can seriously hurt them.
Real earnings
Accounting rules leave room for judgment, adjustments, and assumptions.
Sometimes, management teams use this to make a struggling business look much more profitable than it really is.
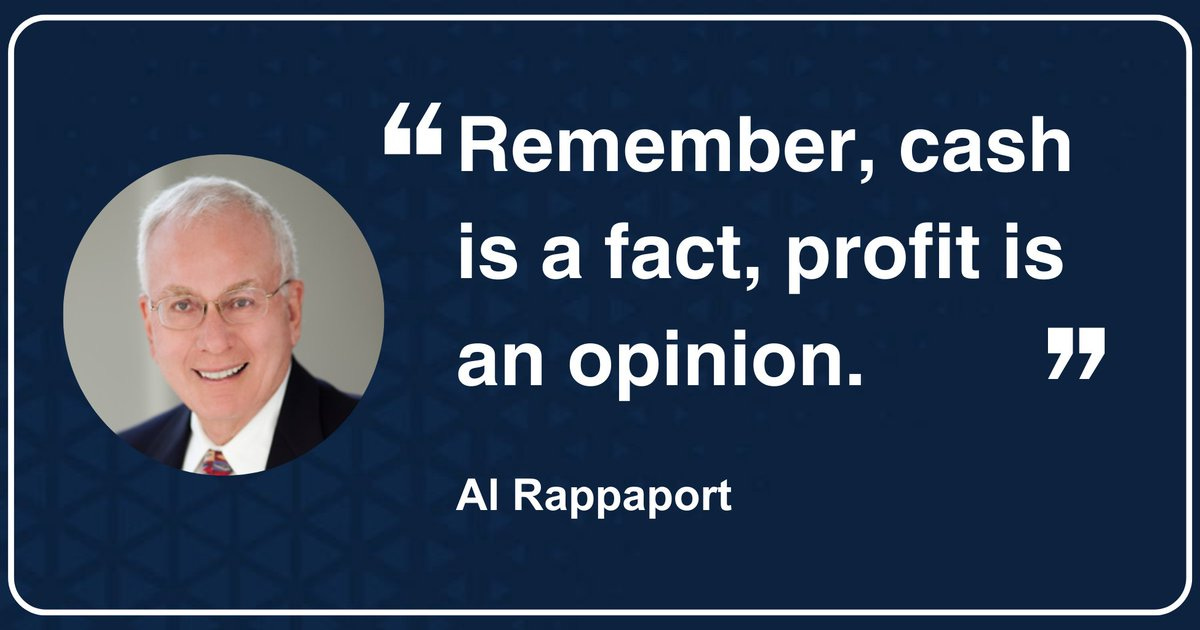
But you can’t fake cash in the bank.
Always remember:
Quality companies make real profits and generate real cash.
Over the long run, a stock’s price follows the performance of the business.
But when it comes to cash generation, this can happen in the short term too.
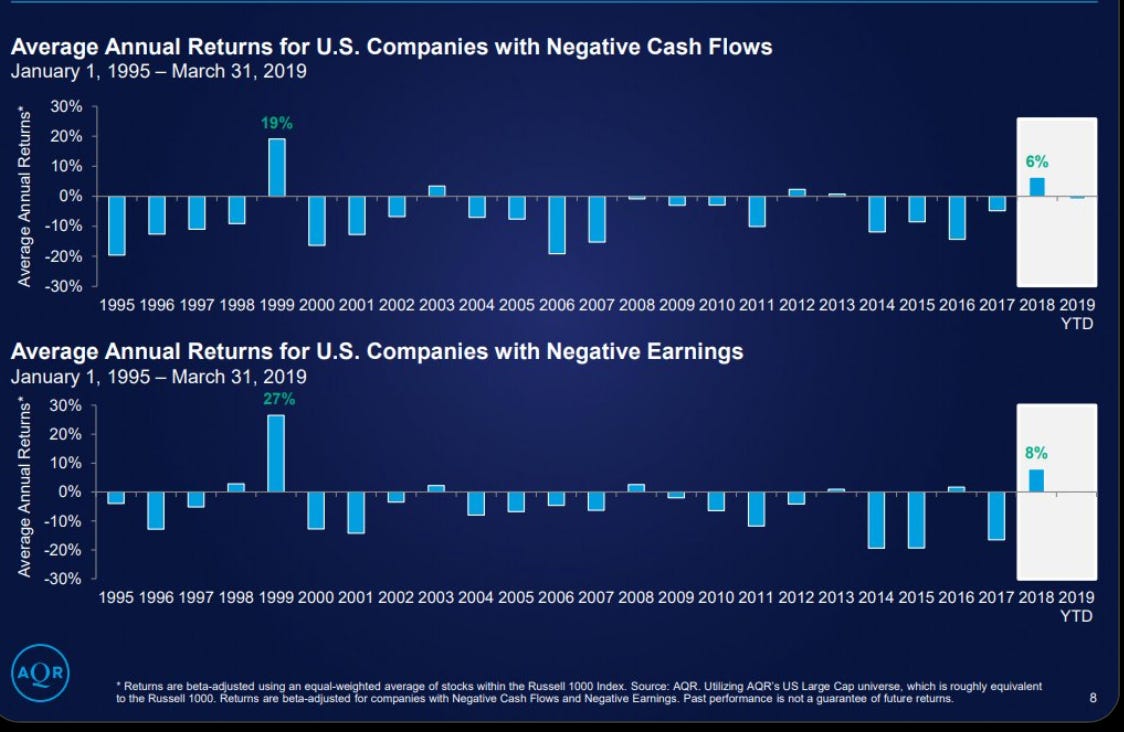
Here’s the average annual return of companies with negative cash flow and accounting earnings:
The conclusion?
Companies with negative cash flow and earnings usually deliver negative stock returns too.
As an investor, you want to make sure the cash flowing in and out of a business matches its reported earnings.
When the two are close, you know you’re buying a business that makes real money.
So wouldn’t it be interesting to start with the S&P 500 and filter it down to the 100 highest-quality companies?
Companies that translate all their net income into pure cash?
That’s exactly what this month’s ETF does.
⭐ ETF of the Month (Spotlight)
Invesco S&P 500 Quality ETF (SPHQ)
Key Information
Name: Invesco S&P 500 Quality ETF
Ticker: SPHQ
Total Expense Ratio: 0.21%
Physical/Synthetic ETF: Physical
ISIN: US46137V2410
European Version
Ticker: SPQA
ISIN: IE000E6TPCH9
What?
The ETF starts with the S&P 500 Index.
It then looks at three things:
Return on Equity (ROE): Shows how well a company turns shareholders’ money into profit.
Financial Leverage: Shows how much a company relies on debt.
Accruals Ratio: Shows how much of a company’s earnings are backed by real cash flow rather than accounting adjustments.
It uses these three metrics to give each of the 500 companies a quality score.
It then keeps only the 100 companies with the highest scores.
Finally, it weights each company based on its quality score and market capitalization.
Why?
When you find companies that can reinvest at attractive rates, grow without taking on too much debt, and turn most of their earnings into cash, you’ve found Quality Companies.
And when you invest in Quality Companies, you can expect to outperform over the long run.
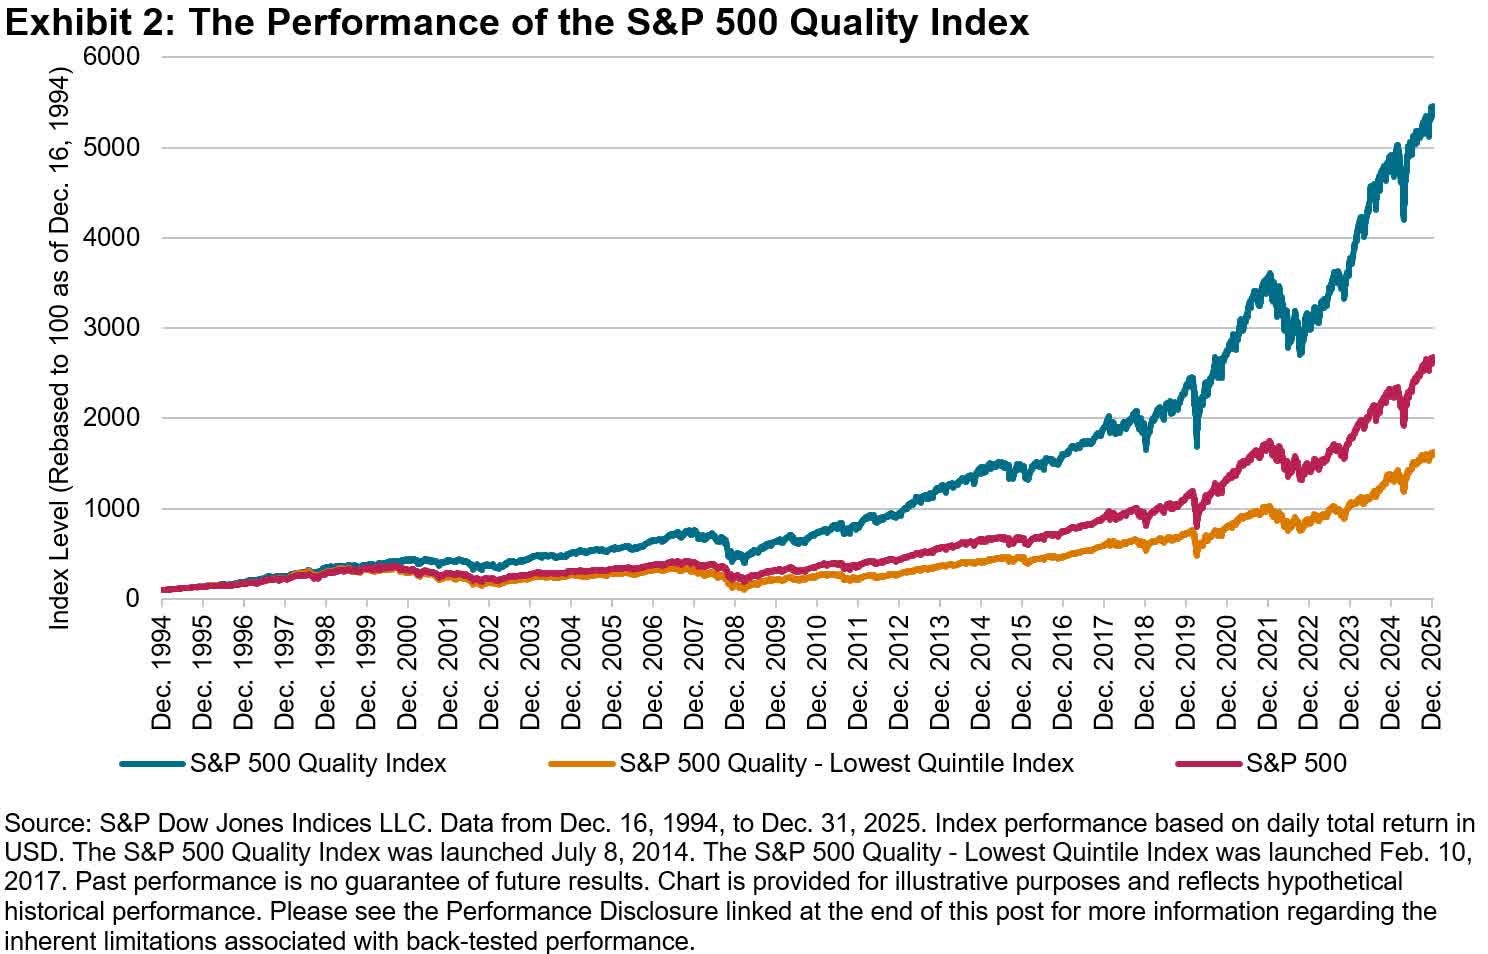
Here’s what the historical performance looks like:
Sector Split
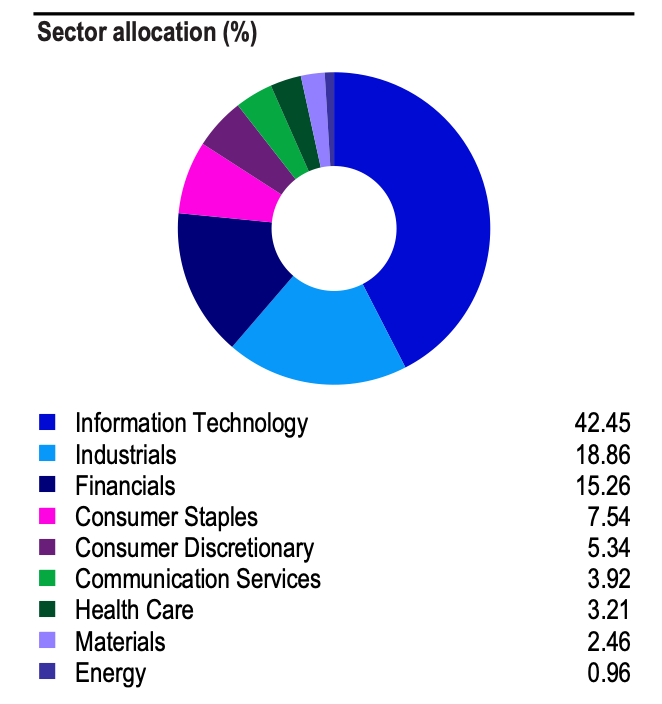
The sector breakdown looks like this.
The three largest sectors are Information Technology (42.5%), Industrials (18.9%), and Financials (15.3%).
Top Holdings
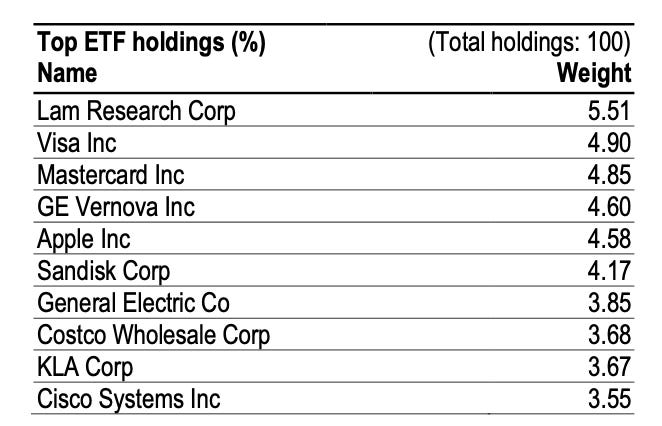
The top 10 positions right now:
ETF Portfolio Update: August 2026
Now, let’s dive into our ETF Portfolio Update.
Our Portfolio is a great mix of ETFs that we believe can outperform over the long run.
We use several factors that have historically performed well:
👑 Quality: Only invest in companies that have already won
📏 Size: The smaller the better
🚀 Multifactor: Quality, size, value & momentum
🌏 Emerging Markets: Small exposure to Emerging Markets
Let’s now dive into the ETF Portfolio itself.
You have 24/7 access to the ETF Portfolio here: