🔍 How to analyze an Income Statement
Everything you need to know about an income statement
Knowing how to analyze an income statement is a must to make good investment decisions.
As an investor, you want to buy profitable companies which make money for you while you sleep.
Learn everything you need to know about Income Statements in this article.
What is an income statement?
An income statement is also called a profit and loss account.
It shows the company's revenue and expenses over a certain period.
The income statement provides you with a lot of insights as it tells you how much revenue is translated into net income, the efficiency of management, and much more.
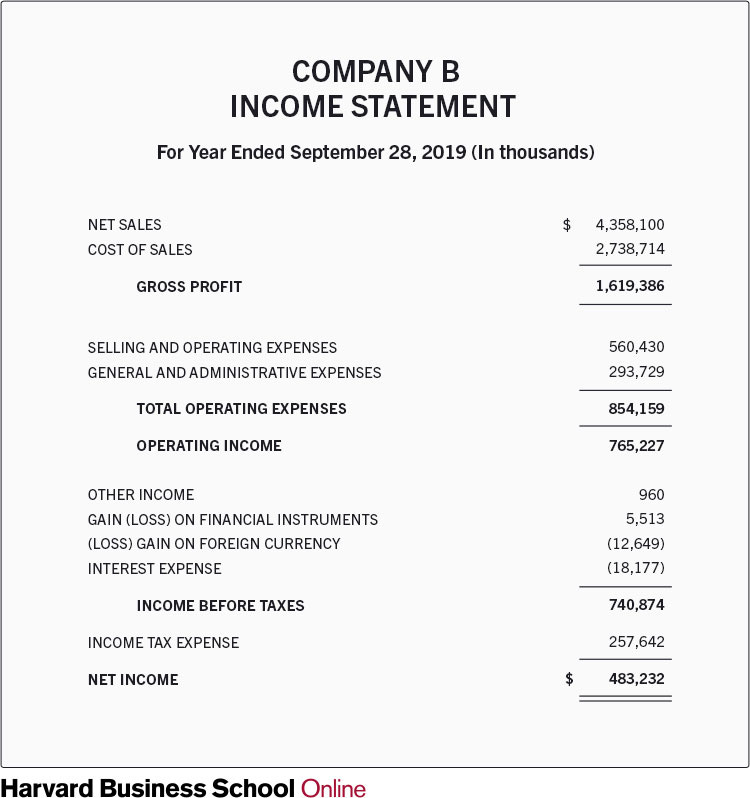
An income statement always has the same format:
I will show you step by step how you can go from revenue to net income.
Revenue
For a company, it all starts with its revenue or sales.
Revenue is the money a company receives from selling its products and/or services.
Let’s say that a fictional company Drink Inc sells 2,179,050 drinks at a price of $2 per drink.
In this example, the company’s revenue is equal to $4,358,100 ($2 * 2,179,050 drinks).
Cost Of Goods Sold (COGS)
The section cost of sales or costs of goods sold (COGS) shows you all the costs a company makes to produce its products and/or services.
When Drink Inc. would need $1.25684 to produce a drink, its COGS would be equal to $2,738,714 million (2,179,050 million drinks * $1.25684 per drink).
Revenue Drink Inc. : $4,358,100
COGS Drink Inc: : $2,738,714
Gross profit
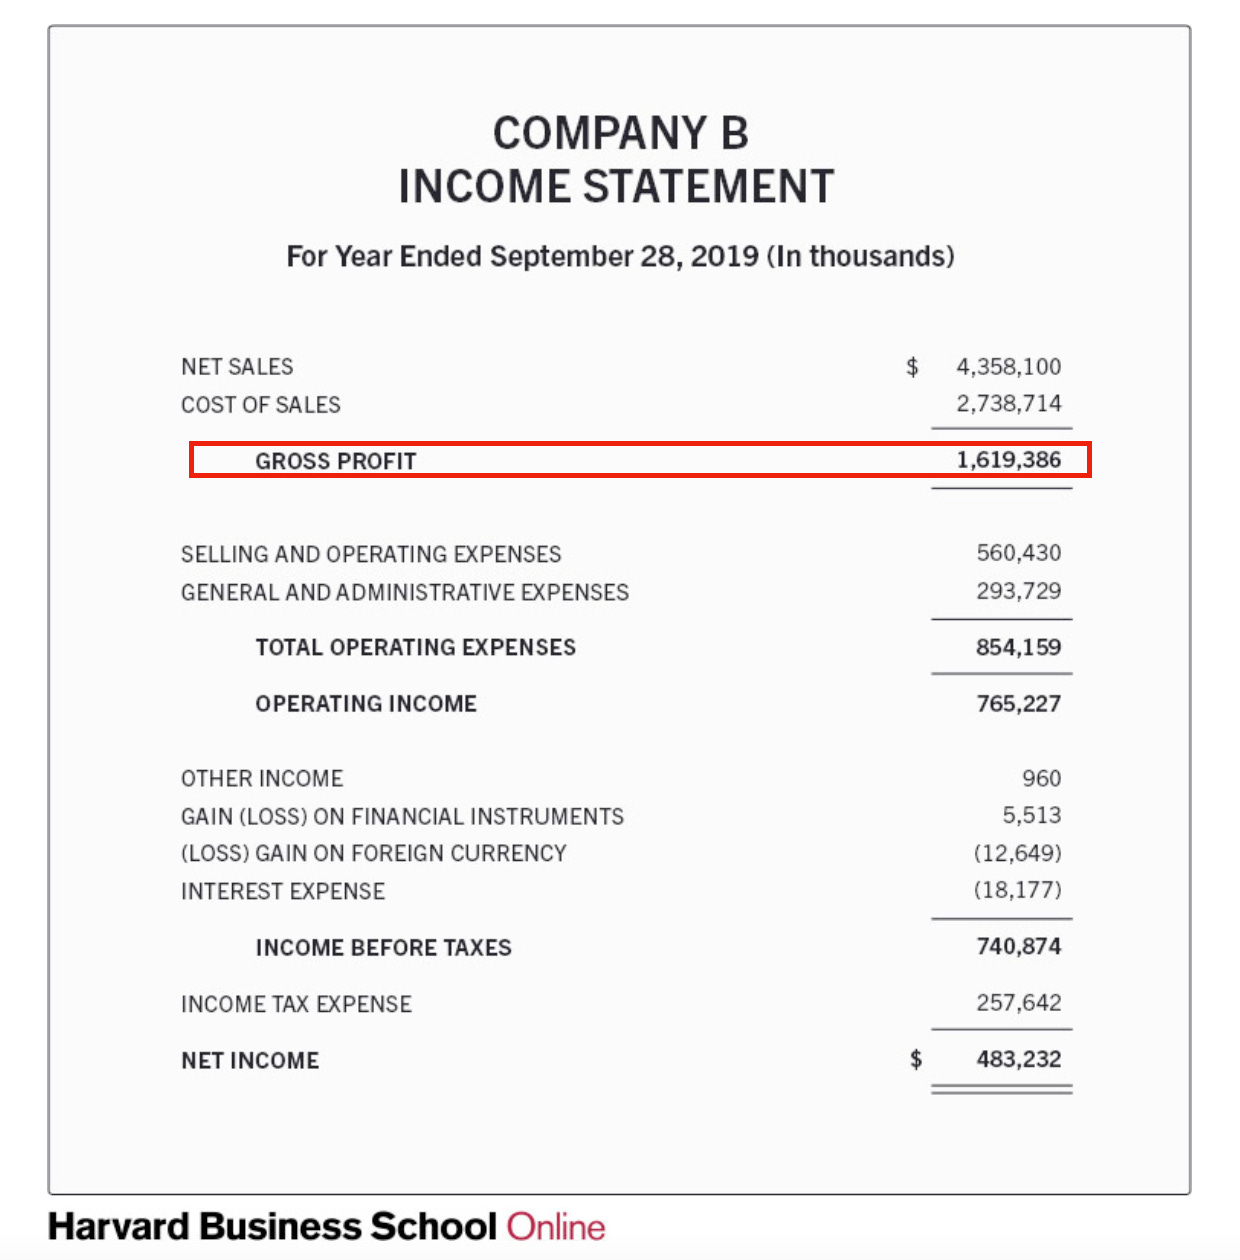
After you know the revenue and COGS of a company, you can calculate the company’s gross profit:
Gross profit = Revenue - COGS
Gross profit Drink Inc. = $4,358,100 - $2,738,714 = $1,619,386
Gross margin
Now you know the gross profit, you can also calculate the gross margin:
Gross margin = Gross profit / Revenue
Gross margin Drink. Inc = $1,619,386 / $4,358,100 = 37.2%
A gross margin of 37.2% means that a company needs $0.628 to produce its products while it can sell them for $1.
The higher the gross margin, the better.
When a company has a very stable and high gross margin, it is often an indication that the company has pricing power.
Operating expenses (OPEX)
The operating expenses or OPEX show you all the expenses a company makes to run its daily operations.
Operating expenses consist out of 4 pillars:
Sales & Marketing
Depreciation & Amortization
Research & Development (R&D)
General & Administrative expenses
In our example Drink Inc. has $560,430 in selling and operating expenses and has $293,729 in general and administrative expenses. As a result, OPEX is equal to $854,159.
Operating income
Now you’ve taken a look at the operating expenses, you can calculate the operating income or EBIT of a company.
The operating income shows you how much money a company earns from its normal business activities.
You can calculate it as follows:
Operating income = Gross profit - Operating expenses
Operating income Drink Inc = $1,619,386 - $854,159 = $765,227
Non-operating income and expenses
Income and expenses that aren’t related to the normal business activities of the company are classified under non-operating income and expenses.
Non-operating income and expenses consist of 4 parts:
Other income
Gain (loss) on financial instruments
Gain (loss) on foreign currency
Interest expenses
Drink Inc. gained $5,513 from financial instruments as well as $960 from the sale of a fixed asset (other income). Drink Inc. also made a loss on foreign currency of $12,649 and has interest expenses of $18,177. This mean non-operating expenses are equal to $24,353 ($5,513 + $960 - $18,177 - $12,649).
Income before taxes
The income before taxes or earnings before taxes (EBT) shows you how much profit the company has made before taxes.
All other costs have now already been taken into account .
Income before taxes = Operating income - Non-operating income and expenses
Income before taxes Drink. Inc = $765,227 - $24,353 = $740,874
Income tax expense
It goes without saying that every company needs to pay taxes.
These taxes are paid to federal, state and local governments.
Drink Inc. needs to pay 34,7754% in taxes (rounded). With an income before taxes of $740,874, this is equal to $257,642.
Net income
The bottom line or net income of an income statement shows you how much money the company has made after subtracting all costs and taxes.
Net income is also known as ‘earnings’ or ‘profit’.
You want this number to be positive as this means the company is making money. Furthermore, the company should be able to grow its earnings at an attractive rate.
Net income = Income before taxes - Taxes
Net income Drink Inc. = $740,874 - $257,642 = $483,232
Profit margin
You can now also calculate the company’s profit margin:
Profit margin = Net income / Revenue
Profit margin Drink Inc. = $483,232 / $4,358,100 = 11,1%
The higher the profit margin, the better.
Why? Because you want to invest in companies that manage to translate most sales into earnings.
Earnings per share
For shareholders, it is very handy to take a look at the earnings per share of a company.
Let’s say that Drink Inc. has 100,000 shares outstanding.
Earnings per share = Earnings / Outstanding shares
Earnings per share Drink Inc = $483,232/ 100,000 = $4.83
Looking at the earnings per share of a company is handy as it allows you to take a look a the valuation by comparing the stock price with its earnings per share.
Let’s say that in our example Drink Inc. has a stock price of $90.
P/E ratio = Stock price / earnings per share
P/E ratio Drink Inc = $90 / $4.83 = 18.6
The lower, the P/E ratio, the cheaper the stock.
Learn more about valuation here: everything you need to know about valuation.
Questions to ask yourself
While looking at an income statement, the following questions can help you to determine whether a company might be interesting:
Are revenues and net income predictable and robust?
Are revenues steadily increasing over time?
Does the company have a high gross margin?
Is the company structurally profitable?
How much revenue is translated into net income?
Financial statement series
That’s it for today. Next week we’ll teach you how to read a Statement of Cash Flows.
If you liked this, you might also be interested in our previous articles in this series:
Every single article we write right now is completely for free. If you liked this, can you please give this article a like and/or let us know in the comments? In 2023, we would love to engage more with our audience.
More from us
Do you want to read more from us? Please subscribe to our Substack where we provide investors with investment insights on a weekly basis.
If you have any suggestions to further improve our posts, or do you want certain topics to be covered? Send us an email:
About the author
Compounding Quality is a professional investor which manages a worldwide equity fund with more than $150 million in Assets Under Management. We have read over 500 investment books and spend more than 50 hours per week researching stocks.


Good job; this i brilliant. Good first post in my mailbox after subscribing.
Thanks for sharing. Its very helpful.