
💊 Kaplan’s Pain Index
How to react to market crashes

Rational investors love declining markets.
It offers great investment opportunities.
Let’s dive into how you can handle market volatility and make sound decisions.

COVID Crash
The COVID crash of 2020 was the fastest market crash in modern history.
Markets plunged, and billions were lost in record time.
The interesting part?
It didn’t just fall fast, it bounced back even faster.
Just six months later, markets were hitting new all-time highs.
Imagine being in a coma, and when you wake up, your other half tells you a global pandemic is taking place.
With a lot of anxiety, you open your broker app to check your stock portfolio…
To your surprise, your portfolio is up +20%.
That’s exactly what happened.
In the chart below, you can clearly spot the COVID crash of March 2020, followed by the lightning-fast rebound for the S&P 500:

The COVID crash proved once again that you can’t time the market.
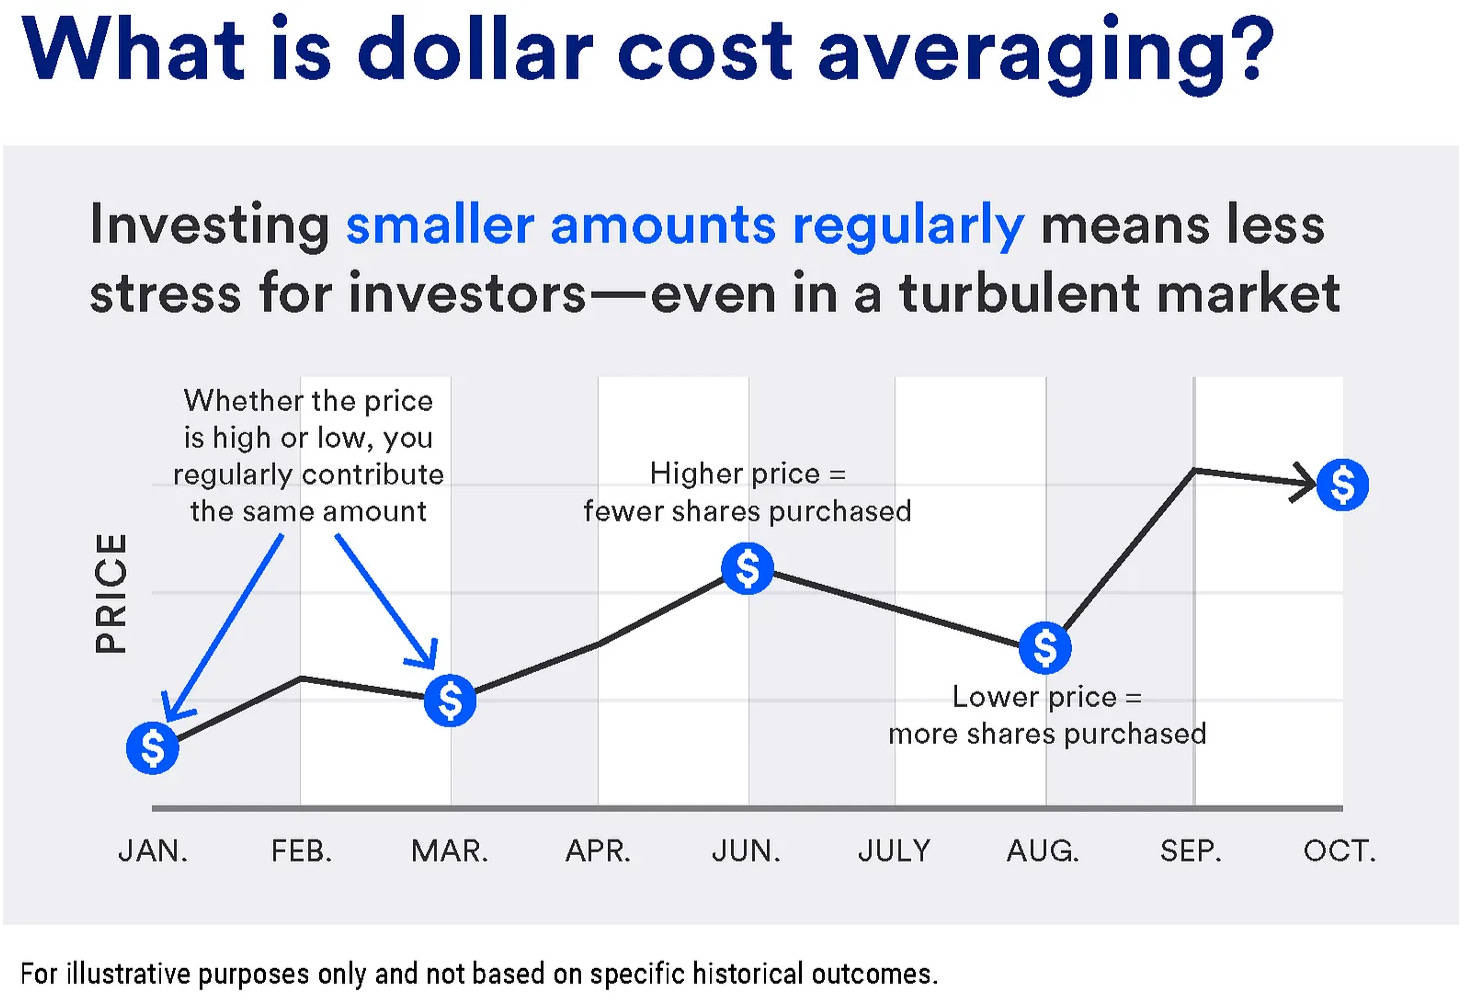
Dollar-Cost Averaging
You can’t time the market. But you can tame it.
That’s exactly what you do with Dollar-Cost Averaging.
It means regularly investing a part of your income into stocks.
My parents do this every single month on the first Monday of the month, for example.
This way you:
Spread your risk
Stay calm when markets drop
Build real wealth over time
But the market doesn’t always recover as quickly as it did after the COVID crash.
In the first decade of this century, investors were hit by two major crises:
The Dot-Com bubble in 2000
The global Financial Crisis eight years later.
It wasn’t until 2012 that markets began to recover.
A lump sum of $14,400 in 2000 shrank to $11,181 by 2012.
But if you had invested $100 every month instead (called Dollar-Cost Averaging), you'd have ended up with $16,351.
Dollar-Cost Averaging outperformed lump sum investing by 35.9%.
The lump sum ended up making a loss, while DCA protected your capital through this exceptionally long bear market.
A period like that, 10 years or more without real growth, is what we call a lost decade.
The market may rise, but not enough to outpace inflation.
")
As shown in the chart above, there have been three lost decades since 1900.
From 1914 to 1945, markets struggled due to two world wars and the 1929 crash.
Between 1973 and 1985, inflation and weak markets left little room for real returns.
Investors need to understand that markets go through ups and downs.
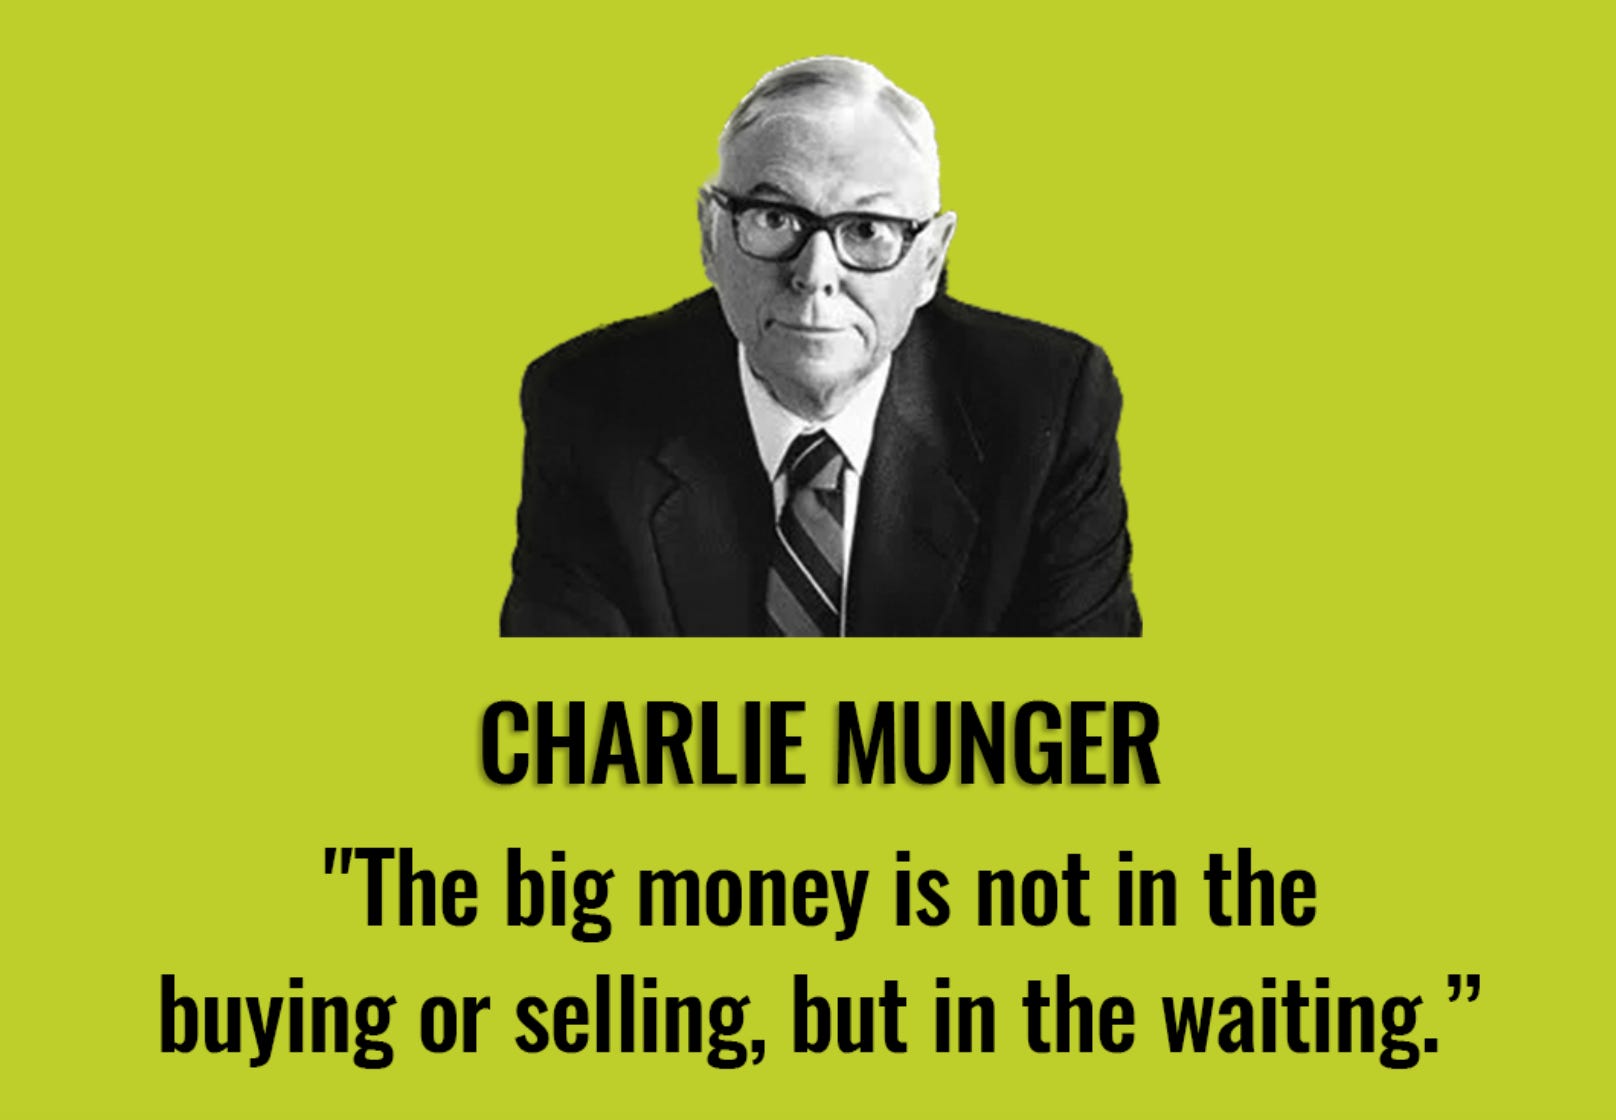
That’s why patience is priceless.
As Charlie Munger famously said:
Just Keep Buying
Between 2000 and 2012, market returns were disappointing.
But what if you stuck with it and kept investing $100 a month in a global ETF from 2012 to 2024?
Your investment would have grown from $28,800 to $88,197.
And this despite the lost decade (2000-2012).
Dollar-Cost Averaging is great because it rewards patience.
The market always recovers eventually.
But patience can be tough when your stocks go nowhere (or even decline).
Investing becomes a mental battle:
You start to doubt yourself
Emotions take over
Discipline fades
…
Long periods of market struggle can hurt.
But how much?
Let’s introduce you to…
The Kaplan’s Pain Index
Not all crashes feel the same.
A 40% drop stretched over ten years feels very different from a quick COVID crash.
The Kaplan Index measures how painful each stock market crash is:
Drawdown: The drop from peak to bottom. The deeper it is, the more it hurts.
Recovery time: How long it takes to recover. The longer it takes, the more it hurts.
Kaplan's formula cuts through the noise. It shows you what a crash actually costs you.
Let's put it to the test with the 2008 Financial Crisis.
Step 1: Use the 1929 market crash as a reference point. This becomes the benchmark = 100% pain.
For the 1929 crash:
Drawdown (market loss from peak): 79%
Recovery time: 4.5 years
For the 2008 Financial Crisis:
Drawdown: 57%
Recovery time: 5 years
Step 2: Calculate the pain surface
Pain surface = Drawdown (%) × Recovery time (years)
For 1929: 79 × 4.5 = 355.5
For 2008: 57 × 5 = 285
Step 3: Compare 2008 to 1929
Kaplan Index 2008 = 285 / 355.5 = 80.2%
Step 4: Conclusion
During the Financial Crisis, investors experienced 80.2% of the pain felt during the 1929 crash.
Let’s now run the same exercise for the COVID crash.
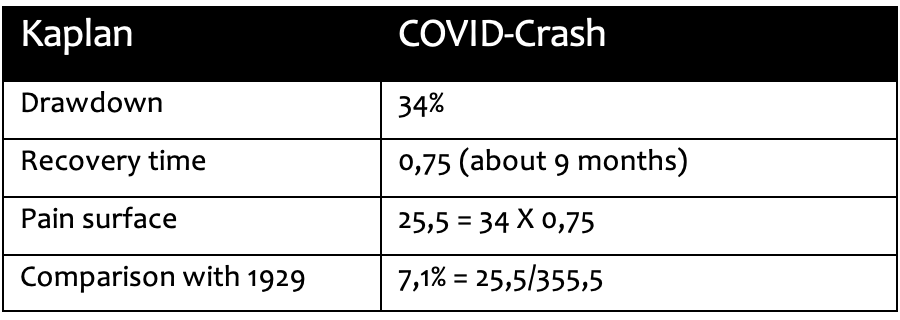
As you can see, the COVID crash scores just 7.1% on Kaplan’s Pain Index.
This is a low score thanks to the rapid recovery.
The table below shows the Kaplan Index for all major crashes since 1920.
Surprisingly, the oil crisis ranks highest.
Markets dropped 48%, but it took eight years to recover.
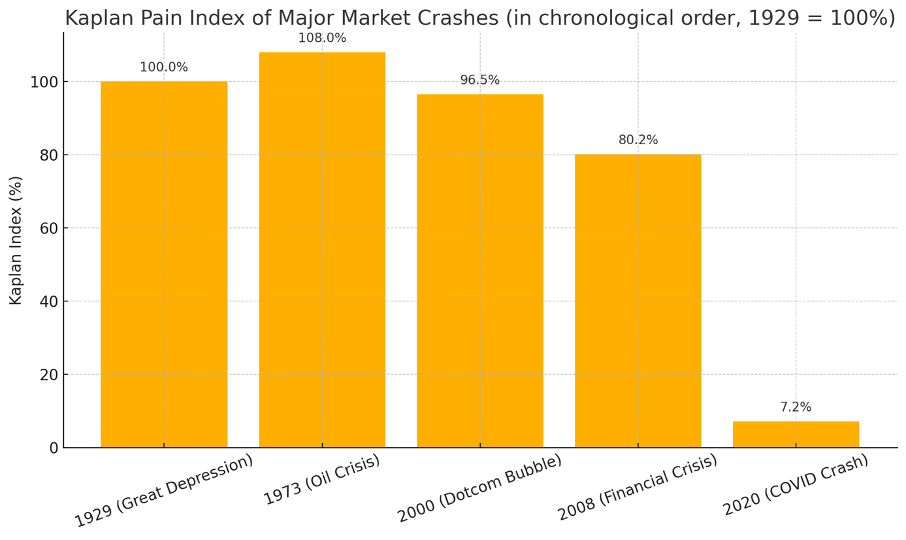
The oil crisis reveals something important about market pain.
Even though markets fell more sharply during the 1929 crash, the dot-com bubble, and the Financial Crisis, the oil crisis felt more painful.
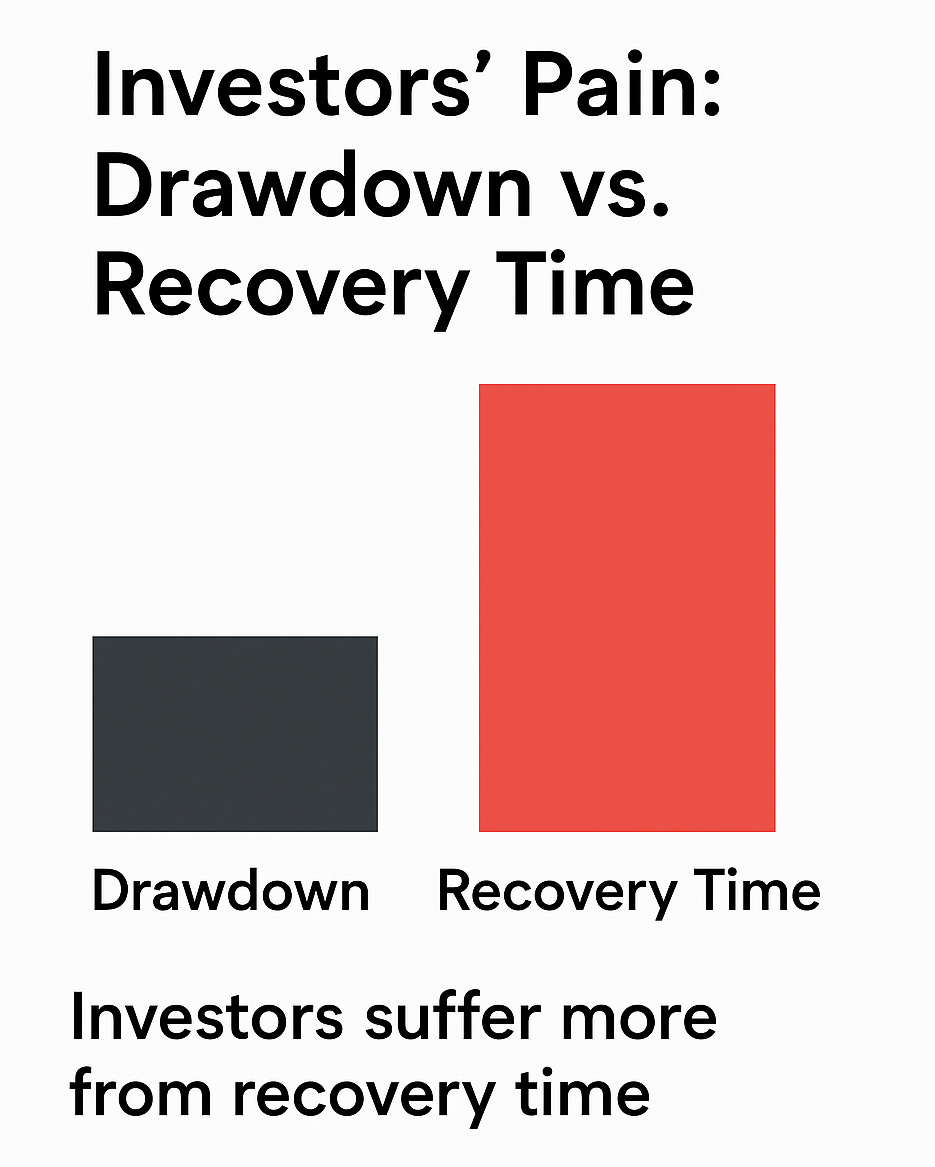
Kaplan’s formula gives equal weight to depth and recovery time, but investors don’t experience them equally.
Investors suffer most from a long recovery time.
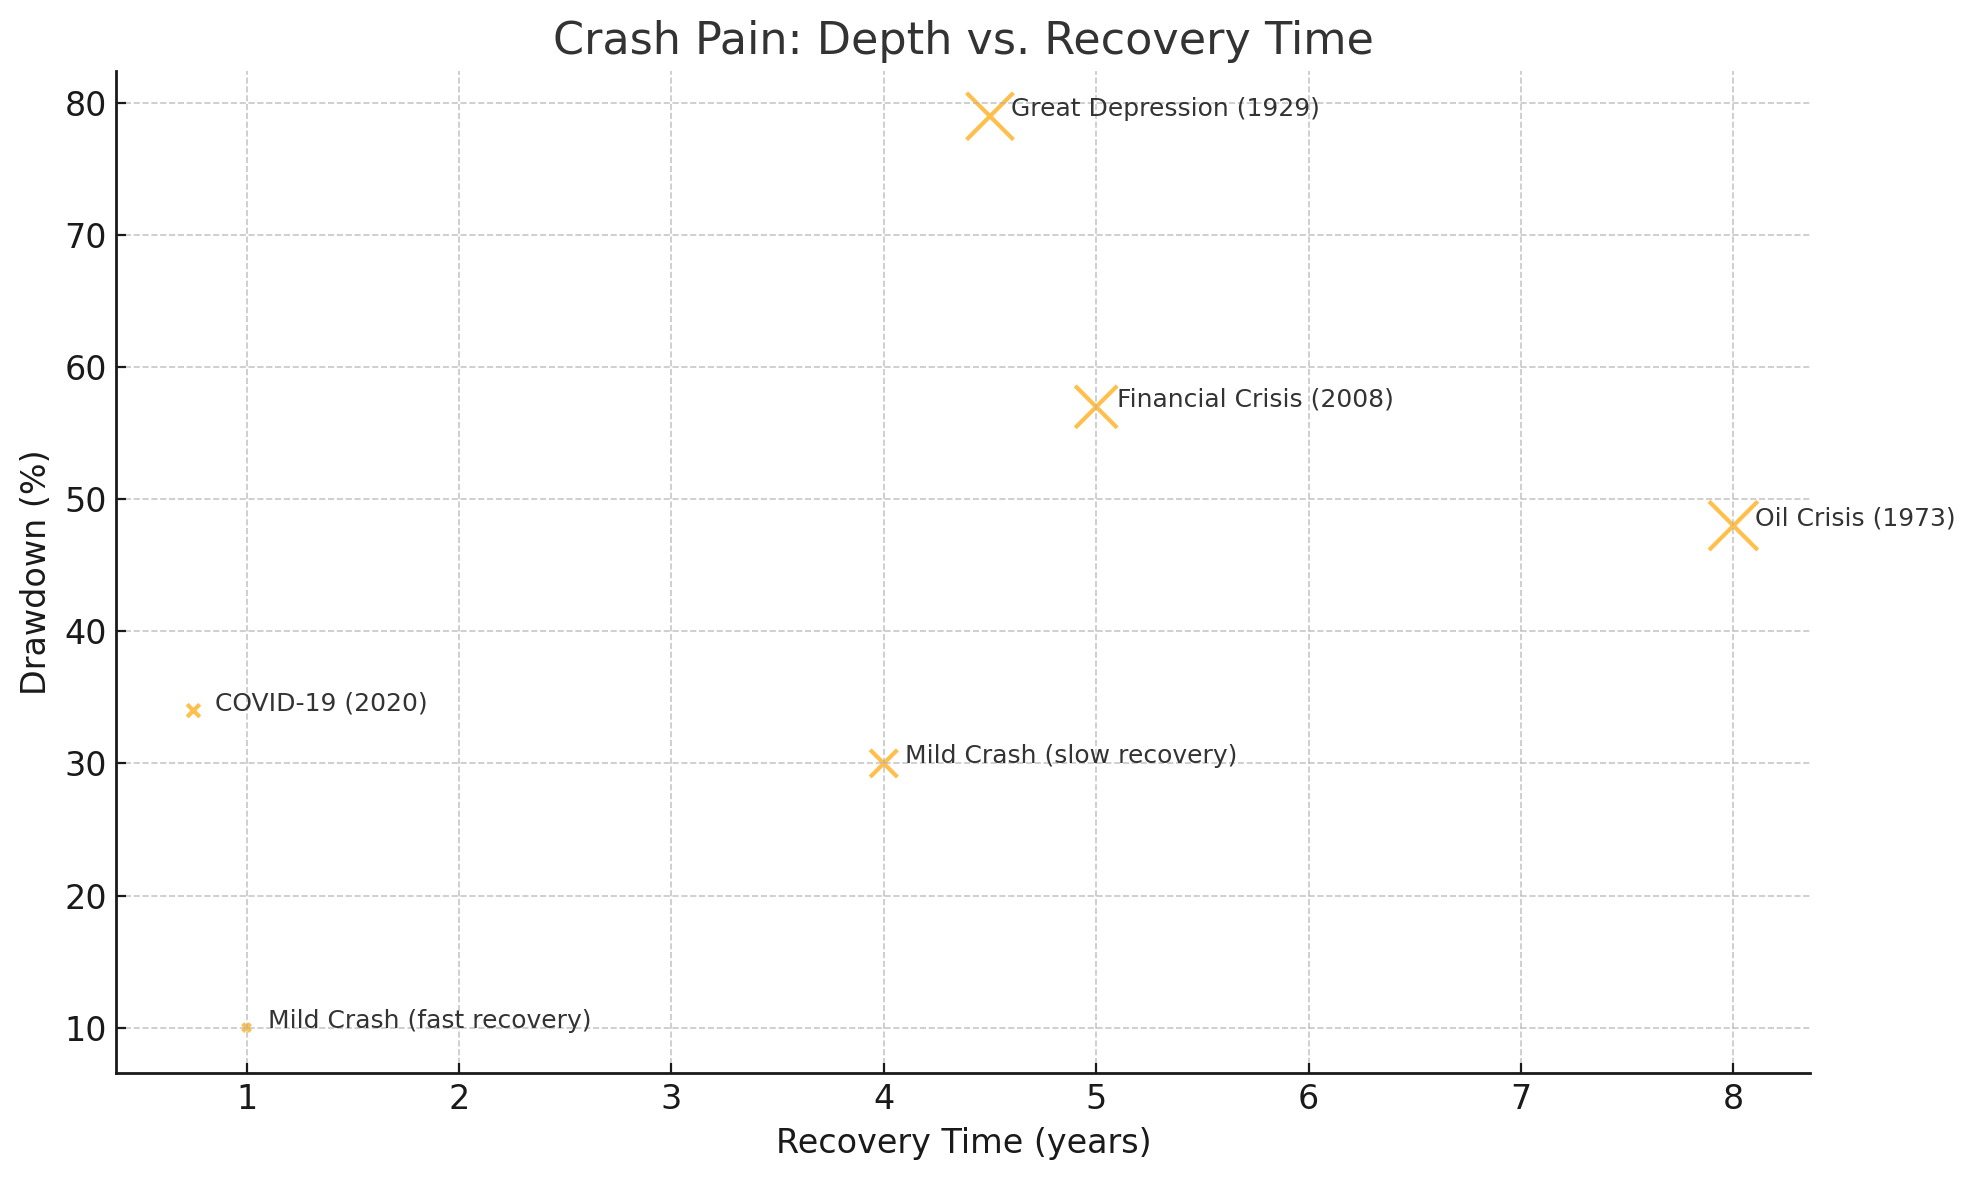
The chart shows various market crashes, along with two hypothetical ones.
The farther up and right, the more painful the crash.
The chart makes it clear: It’s not the crash that hurts, it’s the crawl back.
Conclusion
What can you learn from this as an investor?
It’s not the crash that breaks investors, but the long wait for recovery.The real risk isn’t the market, it is how you react to it.
Dollar-Cost Averaging seems to be the best solution to protect yourself against market volatility.
By investing every single month, you protect yourself from making emotional investment decisions.
Everything In Life Compounds
Team Compounding Quality
PS You are not a Partner of Compounding Quality yet? Discover everything you need to know here.
Book
Order your copy of The Art of Quality Investing here
Used sources
Interactive Brokers: Portfolio data and executing all transactions
Finchat: Financial data
That’s an interesting measure. I would assume then, the bigger the pain the more you will feel inclined to sell - at prices that may turn out to be historically great buying opportunities.
That's a very interesting article that reveals basically how long investors suffer (or wait) until they get back the investment. Normally, I'd expect a structural crisis like the financial crisis in 2007 or the great depression to cause greater "pain" than bubbles that burst without structural consequences like the dotcom bubble. However, the recovery period after the dotcom bubble was so much longer (reminds me of the Japanese stock market in the 90s) because it eventually followed a huge surge in prices that was hype driven. Would be interesting to have the same statistics with a normalized basis (such as relative valuation).