
Reverse DCF Model
Valuation 101

The value of every asset?
All future cash flows it will generate for you as an investor (discounted to today).
In this article, I’ll explain everything you need to know about a Reverse DCF.

Keep Things Simple
The key of investing successfully?
Keep everything as simple as possible.
If you need Excel to figure out whether a stock is interesting or not, it’s probably not.
On Wall Street, analysts try to determine the fair value of a company to two decimal spaces.
That’s silly.
There are so many assumptions you need to make. The more assumptions you make, the more likely you’ll be wrong.
You don’t believe me?
Please don’t take my word for it:
“Some of the worst business decisions I’ve seen came with detailed analysis. The higher math was false precision. They do that in business schools, because they’ve got to do something.” - Charlie Munger.

“It is better to be roughly right than precisely wrong.” - John Maynard Keynes
But how should you value companies instead?
Always Invert
Charlie Munger once said the following:
"If you want to find the solution to a complex problem... Invert, always invert. Turn a situation or problem upside down. Look at it backwards. What happens if all our plans go wrong? Where don't we want to go, and how do you get there?"That’s exactly what you try to do with a Reverse DCF.
Instead of making complex calculations, we just look at what is implied in the current stock price.
How high (or low) are the expectations from other investors? Are these expectations realistic?
Reverse DCF
A reverse DCF is very easy to execute.
You only need to know 3 things:
The current stock price of the company
The number of shares outstanding
The Free Cash Flow in Year 1
We created a template you can use.
It looks as follows:

As you might have noticed already, there are two extra inputs we didn’t talk about yet.
A perpetuity growth rate and discount rate.
Don’t worry too much about this. We always use the same two values for both metrics.
Perpetuity growth rate: This is the growth rate after year 10
We always use 3%. This is the average growth of the global economy
Discount rate: The percentage used to discount future cash flows to today, accounting for risk and time
We always use the discount rate as a proxy for our expected return
We always use 10%
At a discount rate of 10%, you can expect a yearly return of 10% as an investor
Don’t worry if this looks overwhelming.
I’ll guide you through the process.
Let’s give an example to make everything clear.
Reverse DCF Spreadsheet
To go over an example, it’s a great idea to download the spreadsheet.
By doing this, we can go over the examples together.
Example: Microsoft
Let’s look into a Reverse DCF for Microsoft.
We need to know three things:
The current stock price of the company
The number of shares outstanding
The Free Cash Flow in Year 1
The current stock price is easy to determine.
We go to Finchat and see that the stock price for Microsoft equals $412.2.

Now we need to figure out how many outstanding shares Microsoft has.
How?
Go to Finchat
Look for the company Microsoft
Go to Financials
In the search bar, look for ‘Shares Outstanding’

When you click on ‘Total Shares Outstanding’, you see Microsoft has 7.436 million shares outstanding:

The only thing we still need to know is the expected Free Cash Flow for the next year.
How?
Go to Finchat
Look for the company Microsoft
Go to Estimates
Click on ‘Free Cash Flow’
The expected Free Cash Flow for 2025 equals $68.2 billion.
Two adjustments to Microsoft’s Free Cash Flow are made:
We subtract Stock-Based Compensation as it’s a cost for shareholders
We add Growth CAPEX
Stock-Based Compensation
Stock-based compensation is a cost for shareholders.
As a result, we subtract it from Microsoft’s Free Cash Flow.
Stock-based compensation can easily be found in Finchat:
Go to Finchat
Look for the company Microsoft
Go to Financials
In the search bar, look for ‘Stock-Based Compensation’

Microsoft’s Stock-Based Compensation equals $11.059 million.
Adding Growth CAPEX
A distinction can be made between Maintenance CAPEX and Growth Capex:
Maintenance CAPEX: Investments made in existing assets
Growth CAPEX: Investments made in new assets in order to grow
When a company invests a lot in future growth, its growth CAPEX is very high but these investments should create a lot of value in the long term.
As a rule of thumb, we state that the company’s maintenance CAPEX equals Depreciation & Amortiziation.
CAPEX = Maintenance CAPEX + Growth CAPEX
Wherein Maintenance CAPEX = Depreciation & Amortization

Growth CAPEX = Total CAPEX - Depreciation & Amortization
How to find both metrics?
Go to Finchat
Look for the company Microsoft
Go to Financials
In the search bar, look for ‘Capital Expenditures’ and ‘Depreciation & Amortization’
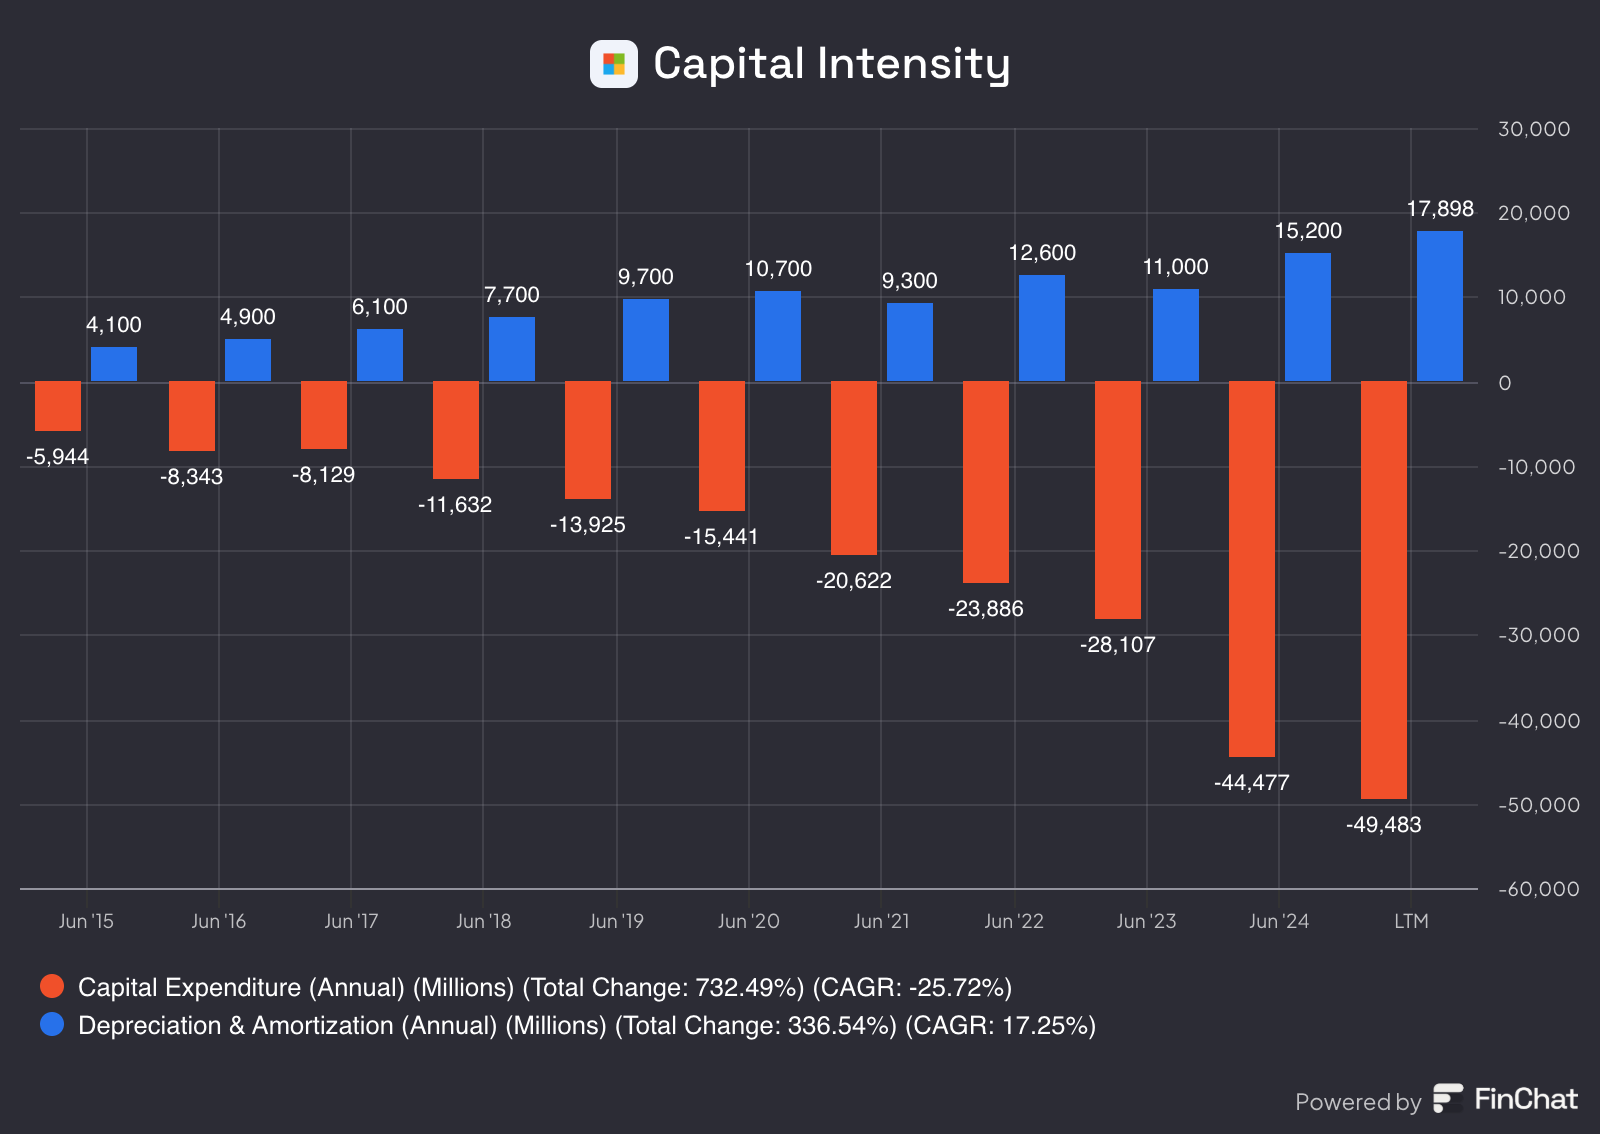
As you can see, Capital Expenditures are equal to $49.483 million and Depreciation & Amortization equals $17.808 million.
Now we can calculate the Growth CAPEX.
Growth CAPEX = Total CAPEX - Depreciation & Amortization
Growth CAPEX = $49.483 million - $17.808 million = $31.675 million
As we now the Free Cash Flow, Stock-Based Compensation and Growth CAPEX, we can now calculate the adjusted Free Cash Flow we use in our model:
Adjusted Free Cash Flow = Free Cash Flow - Stock-Based Compensation + Growth CAPEX
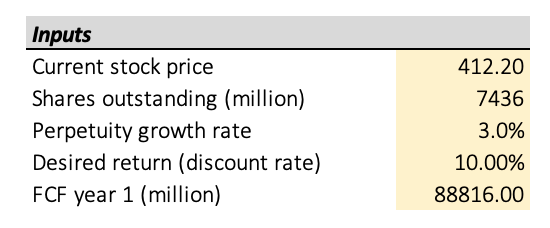
Adjusted Free Cash Flow = $68.200 million - $11.059 million + $31.675 million = $88.816 millionNow we go to our Excel Spreadsheet and fill in all the information:
Cel C5 = Stock Price: $412.2
Cel C6 = Shares Outstanding: 7.436 (million)
Cel C7 = Perpetuity growth rate: 3% (we always keep this at 3%)
Cel C8 = Desired Return: 10% (we always keep this at 10% - we want to achieve a return of at least 10% as an investor)
Cel C9 = Free Cash Flow Year 1: $88.816 million
Our input now looks as follows:
The only thing we still need to do is click the ‘Calculate Growth Rate’ button.
After you click it, you get the following:

But what does this mean?
Look at the number in green in cell C11 (growth rate year 1-10).
This number shows you how much Microsoft’s Free Cash Flow should grow in the next 10 years to generate a return of 10% per year for you as a shareholder.
Microsoft needs to grow its FCF by 16.6% per year to generate a return of 10% per year for you as a shareholder.
Is this realistic?
Let’s look at two things:
The historical Free Cash Flow Growth of Microsoft
Analysts’ expectations
Historical Free Cash Flow Growth
How to find this number?
Go to Finchat
Look for the company Microsoft
Go to Financials
In the search bar, look for ‘Free Cash Flow’ and click on it
The evolution of Microsoft’s Free Cash Flow looks as follows:

As you can see in the chart above, Microsoft has grown its FCF by 12.9% per year over the past 10 years (CAGR).
Analysts’ expectations
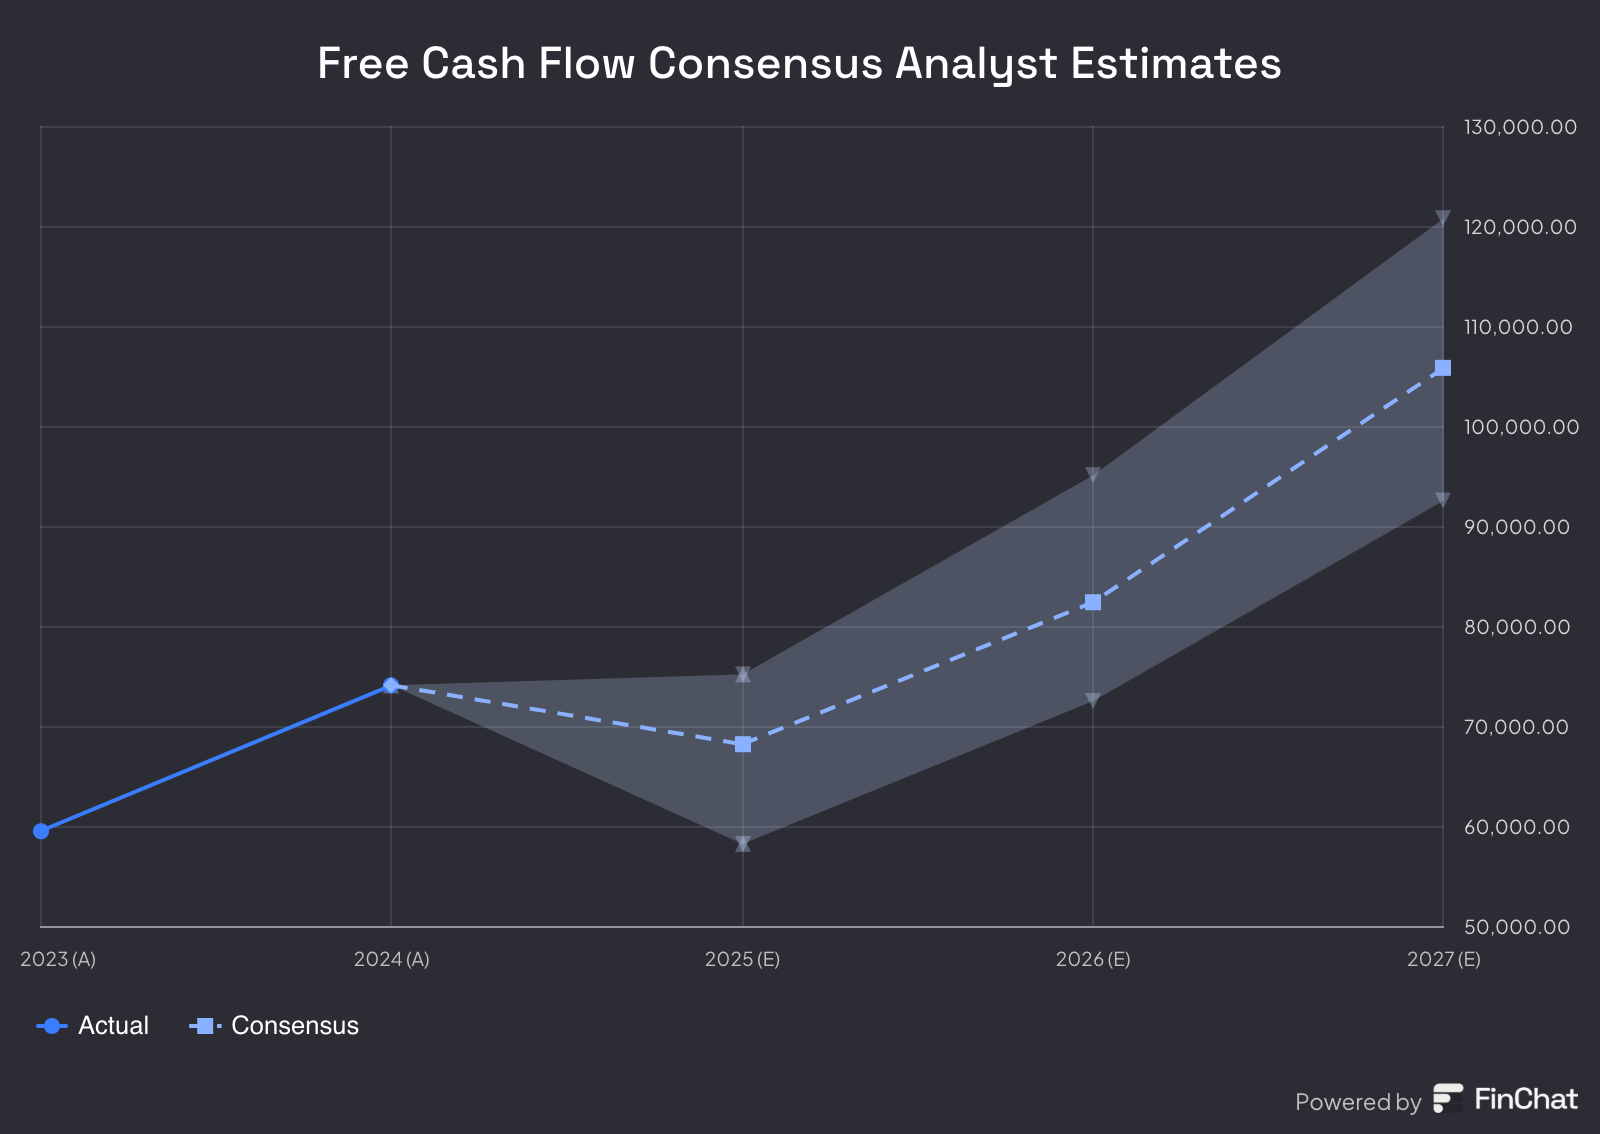
Now we are going to look into what analysts expect from Microsoft in the years ahead.
How to find this number?
Go to Finchat
Look for the company Microsoft
On the general dashboard, look for ‘EPS LT Growth Est.’
Earnings Per Share (EPS) isn’t the same as Free Cash Flow, but we use it as a proxy because Free Cash Flow Estimates aren’t available.
As you can see below, analysts expect Microsoft to grow its FCF by 13.3% per year.

Is Microsoft overvalued or undervalued?
Now we determine whether Microsoft is overvalued or undervalued.
Expectations implied in the current stock price (Reverse DCF): 16.6%
→ Microsoft should grow its FCF by 16.6% per year to generate a return of 10% per year for you as an investor
Is this realistic?
→ Microsoft has grown its FCF by 12.9% per year over the past 10 years
→ Analysts expect Microsoft to grow its FCF by 13.5% per year in the years ahead.
As you can see, what is implied in the current stock price (Reverse DCF) is more than what we expect from Microsoft in the years ahead.
As a result, Microsoft looks expensive today.
Conclusion
That’s it for today.
Here are the key takeaways:
A reverse DCF is the best way to value a company
You shouldn’t use complex formulas to determine the fair value of a business
A reverse DCF shows you how much growth the stock price has priced in. You compare this growth rate to your own expectations to determine whether the company is undervalued
You can open and download the Excel attached to this article to calculate the implied growth in the stock prices of the companies you own
Everything In Life Compounds
Pieter
PS Did you know that The Art of Quality Investing is now available at a discount on Amazon?
Used sources
Interactive Brokers: Portfolio data and executing all transactions
Finchat: Financial data