


Since its IPO in 1984, Costco returned 29,580%.
This means an investment of $10,000 would be worth $2.96 million (!).
The good news? The stock we just bought reminds me a lot of Costco.
But they still have way more upside potential.

The Next Costco?
Quite a while ago, in 1999, a self-made entrepreneur lanched a grocery company. The remarkable thing? It wasn't just any grocery company - it was (and still is) one of the fasting growing grocery companies in the world.
Starting with just one store in 1999, they evolved to 111 stores in 2010 and 2,540 stores today. The beautiful thing? I think the number of stores can still double from today’s levels.
Their stores are unique too. They're not too big, not too small, just the right size for a quick grocery run. This standardization gives them a strong advantage over peers. Combine this with the fact that the company owns almost all its stores and you know that they have a strong competitive advantage.
Now, let me tell you about the founder of this unique company. It’s the perfect example of a self-made businessman. He is well known for his frugality and always puts the shareholder first. The story goes that he was even involved in picking the lowest-cost basket maker for garbage collection at the stores. And this while his net worth is more than $6 billion!
And the best part about this investment case? The company keeps reinvesting all its profits to grow even faster.
That’s exactly how the power of compounding can do its magic.

Portfolio
You want to find out which stock I just bought? As well as all the other names within the Portfolio?
Take a subscription on Compounding Quality and find out:

Since Compounding Quality launched on the 1st of October 2023, the Portfolio returned 34.1% versus 16.4% for the S&P 500.
This means we did 17.7% better than the S&P500 over the past 5 months.
Is this level of outperformance sustainable? Absolutely NOT.
The goal is to outperform the index by 3% in the very long term and we don’t care about short-term market fluctuations.

Thank you for reading!
Email any questions to compoundingquality@gmail.com.
Pieter (Compounding Quality)
Disclaimer
Disclaimer: The Accuracy of Information and Investment Opinion
The content provided on this page by the publisher is not guaranteed to be accurate or comprehensive. All opinions and statements expressed herein are solely those of the author.
Publisher's Role and Limitations
Compounding Quality serves as a publisher of financial information and does not function as an investment advisor. Personalized or tailored investment advice is not offered. The information presented on this website does not cater to individual recipient needs.
Not Investment Advice
The information found on this website should not be interpreted as investment advice, nor does it express any viewpoint on the future trading prices of any company's securities. The opinions and information shared here should not be taken as specific guidance for making investment decisions. Investors are encouraged to conduct their own research and evaluations based on publicly available information, rather than relying on the content herein.
No Offer or Solicitation
The content, including opinions and expressions, present on this website, is not a direct or indirect offer or solicitation to buy or sell securities or financial instruments mentioned.
Forward-Looking Statements and Uncertainties
Any forward-looking statements, projections, or market forecasts contained in this content are inherently uncertain and speculative. They are based on certain assumptions and may not accurately reflect actual future events. Unforeseen events might impact the performance of discussed securities significantly. The provided information is current as of the preparation date and might not apply to future circumstances. The publisher is not obligated to correct, update, or revise the content beyond its initial publication date.
Position Disclosures
The publisher, its affiliates, and clients may hold long or short positions in the securities of companies mentioned. Such positions are subject to change without guarantee.
Liability Disclaimer
Neither the publisher nor its affiliates assume liability for any direct or consequential losses arising directly or indirectly from the use of the information provided in this content.
Consent and Agreement
By accessing the site or affiliated social media accounts, you signify your agreement to this disclaimer and the terms of use. Unauthorized reproduction of the content, whether through photocopying or other means, is unlawful and subject to legal consequences.
Website Ownership and Terms
Compounding Quality (www.compoundingquality.net) is operated by Substack. By accessing the site, you agree to adhere to the current Terms of Use and Privacy Policy. These terms are subject to potential amendments. The content on this site does not constitute an offer to buy, sell, or subscribe to securities where prohibited by law.
Regulation and Investment Guidance
Compounding Quality is not an underwriter, broker-dealer, Title III crowdfunding portal, or valuation service. The site does not provide investment advice or transaction structuring.
Compounding Quality does not validate the adequacy, accuracy, or completeness of information provided. Neither the publisher nor any associated parties make any warranties, explicit or implied, regarding the information's accuracy or the use of the site.
Investing in securities carries substantial risk, and investors should be prepared for potential loss. Each individual should independently assess whether to invest based on their own analysis.
____
The company we’re talking about is a grocery company.
They are one of the fastest-growing retail grocery networks in Poland measured by the number of stores and revenues. Over the years, Dino Polska evolved from 111 stores in 2010 to 2,540 stores today. A typical Dino store earns a gross margin of 25%, an EBIT margin of 10%, and an ROIC of 30% at maturity. Every new store has a pre-tax internal rate of return of 20.5%.
The business model is focused on a standardized store design, equipped with parking places for its customers and supplied with fresh products every day of the week. Almost 90% of Dino’s revenue is derived from food (fresh products and other groceries).
The company focuses on compact stores in less urbanized areas like small towns, villages, and suburban districts. On average, a Dino Polska store encompasses 4,300 square feet (about 400 square meters). Each location offers a selection of approximately 5,000 different products, with a notable 95% being brand-name products.
While most rivals lease their stores, Dino Polska has purchased all real estate for their stores since 2010. Today, Dino Polska owns 95% of its stores. All these stores are standardized. They are each around 400 square meters in size, sell the same products, and are arranged similarly. The fact that they own their stores and competitors don’t, provides Dino Polska with a competitive advantage.
Dino Polska has a sustainable competitive advantage for sure. They have the lowest grocery prices in Poland, a wide offering and it’s the only grocery company in the country that owns (nearly) all its real estate. Its management focuses on the long-term and they are a clear market leader in rural areas. It would take a competitor more than $1.5 billion (!) to rebuild Dino’s store network. Furthermore, Dino also benefits from economies of scale. Dino doesn’t use middlemen and supplies most SKUs directly from main representatives or producers.
The Polish market also looks quite attractive. Poland has one of the fastest-growing GDP per capita rates globally. From 1990, GDP per capita in Poland grew from $1,731 to more than $20,000 today. The end market for Dino Polska has grown at a CAGR of 5.4% since 2009 and it is expected to grow at a CAGR of 7.4% until 2027 (mainly because of higher inflation).
Dino Polska is the third largest grocery retail brand in Poland with an estimated market share of 5%. Dino’s largest competitor is Biedronka (23.4% market share). So far, branded grocery stores have been taking market share at the expense of traditional mom-and-pop stores.
The fundamentals of Dino Polska look great. They almost have no debt on their balance sheet and they have a negative cash conversion cycle. This means that customers of Dino Polska pay them earlier than Dino needs to pay its own suppliers.
Dino Polska also doesn’t require too much capital to grow as their Maintenance CAPEX/Sales is equal to 1.4%.
What makes them unique is that Dino can reinvest ALL free cash flow in organic growth. They reinvest everything back in the business and this while their ROIC looks attractive (21.6%).
That’s how Compounding Machines are created! In the years to come, Dino will keep focusing relentlessly on organic growth.
Dino Polska currently operates at a Gross Margin of 26.1% and a Net Profit Margin of 5.6%. The profitability isn’t sky-high, but this is no problem as Dino is active in the grocery business. They have a negative cash conversion cycle and their asset turnover ratio is high. Another positive? Dino’s profitability will increase in the years to come thanks to operating leverage. Today, 942 stores are less than 3 years old. As Dino has 2,340 stores, this means 40% of their stores haven’t reached full maturity and profitability yet!
In the past, Dino Polska has grown at very attractive rates. They have proven roll-out capabilities and they are massively expanding to the East of Poland. Over the past 10 years, Dino has grown its revenue and EPS at a CAGR of 32.4% and 41.5% respectively.
The future still looks bright too. The company is expanding heavily to the east of Poland. Over time, they can also make the strategic choice to expand to its neighboring countries: Czech Republic, Slovakia, and Lithuania. Currently, management has a target of increasing its store base by 20% every year. We think that Dino can still double its number of stores from today’s levels. Shreekkanth Viswanathan from SVN Capital thinks Dino can grow to 5,300 stores over time (currently: 2,340 stores).
Dino Polska trades at a forward PE of 22.8x versus a historical average of 31.2x over the past 5 years. Our Earnings Growth Model estimates that the yearly return for shareholders will be equal to 10.5% and our reverse DCF indicates that Dino should grow its FCF by 9.2% per year to return 10% per year to shareholders.
In the past, Dino also created a lot of shareholder value. The company grew its Owner’s Earnings by 27.9% per year over the past 5 years and since their IPO in 2017, they compounded at 44.2% (!) per year.
Quality Score
Every company within the Portfolio gets a Quality Score based on 15 metrics.
Finally, the company gets a ‘Total Quality Score’ which is simply calculated by taking the sum of the score of all 15 metrics and dividing it by 15.
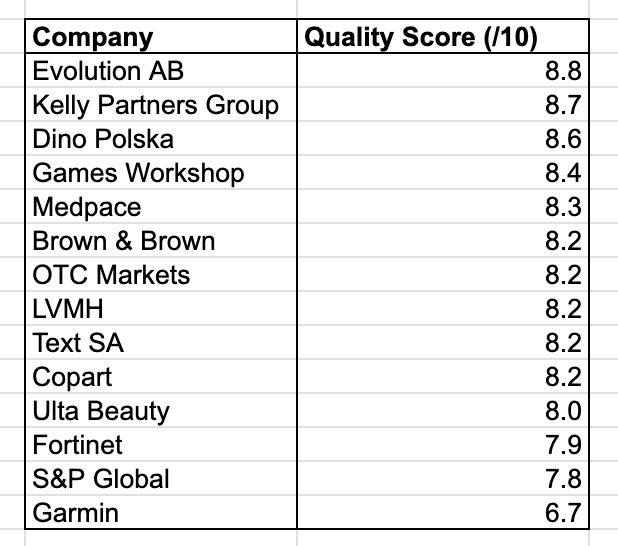
Dino Polska gets a Total Quality Score of 8.6/10.

Here’s an overview of the Quality Scores of all companies so far:
That’s it for today. If you enjoyed this piece, please hit the “Like” button. Thank you for your support!
Join the community
You didn’t join the Community yet?
It’s as valuable as the newsletter itself.
You can join here:
Used sources
Interactive Brokers: Portfolio data and executing all transactions
Finchat: Financial data