

There are about 900 (!) million dogs in the world.
That’s more than twice the population of the United States.
The pet industry is massive. Let’s look at Zoetis, a quality company in a booming business.

Zoetis - General Information
👔 Company name: Zoetis
✍️ ISIN: US98978V1035
🔎 Ticker: ZTS
📚 Type: Oligopoly
📈 Stock Price: $167
💵 Market cap: $75.3 Billion
📊 Average daily volume: $492 Million
Onepager
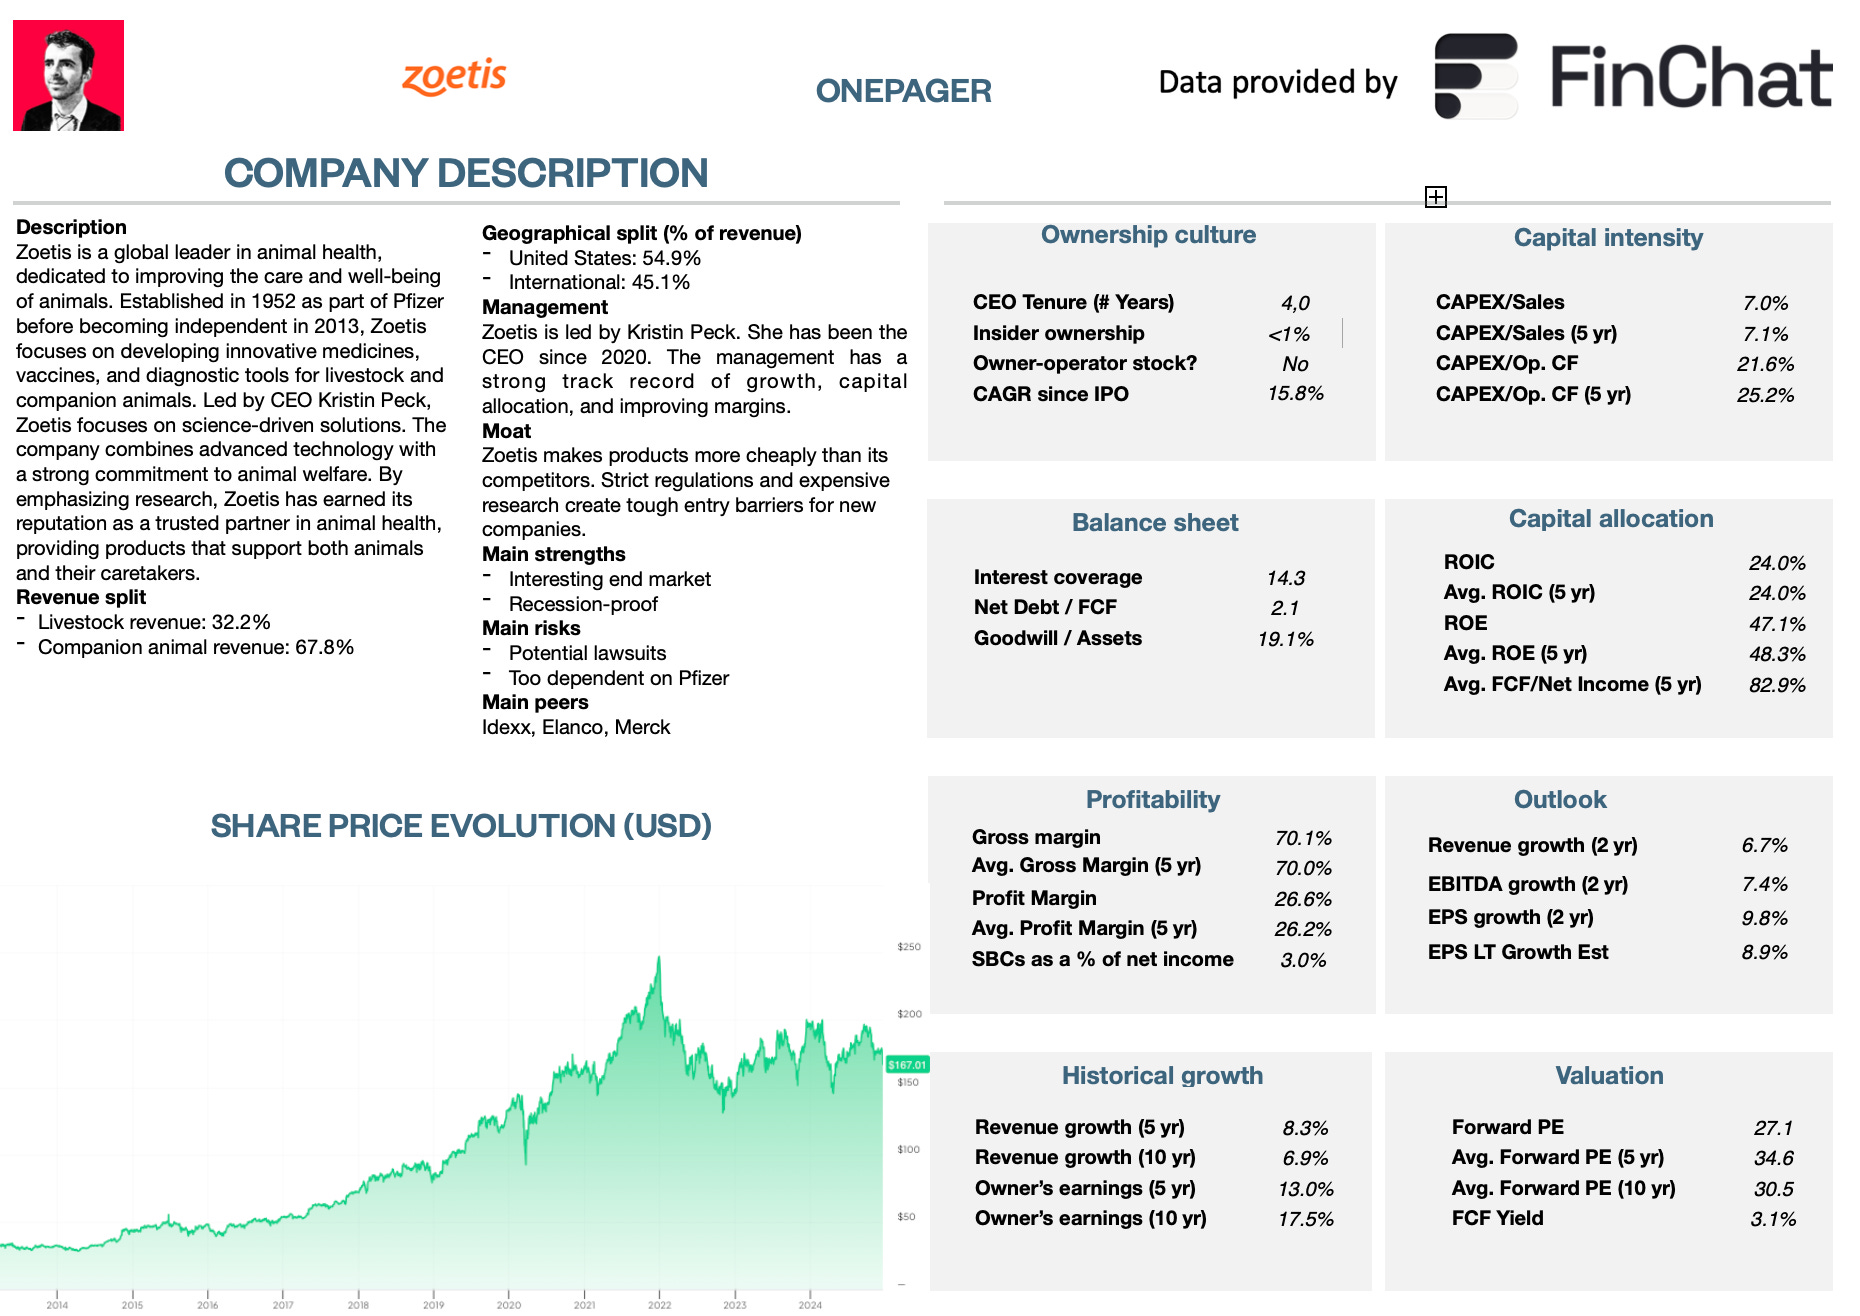
Here’s a onepager with the essentials of Zoetis
15-Step Approach
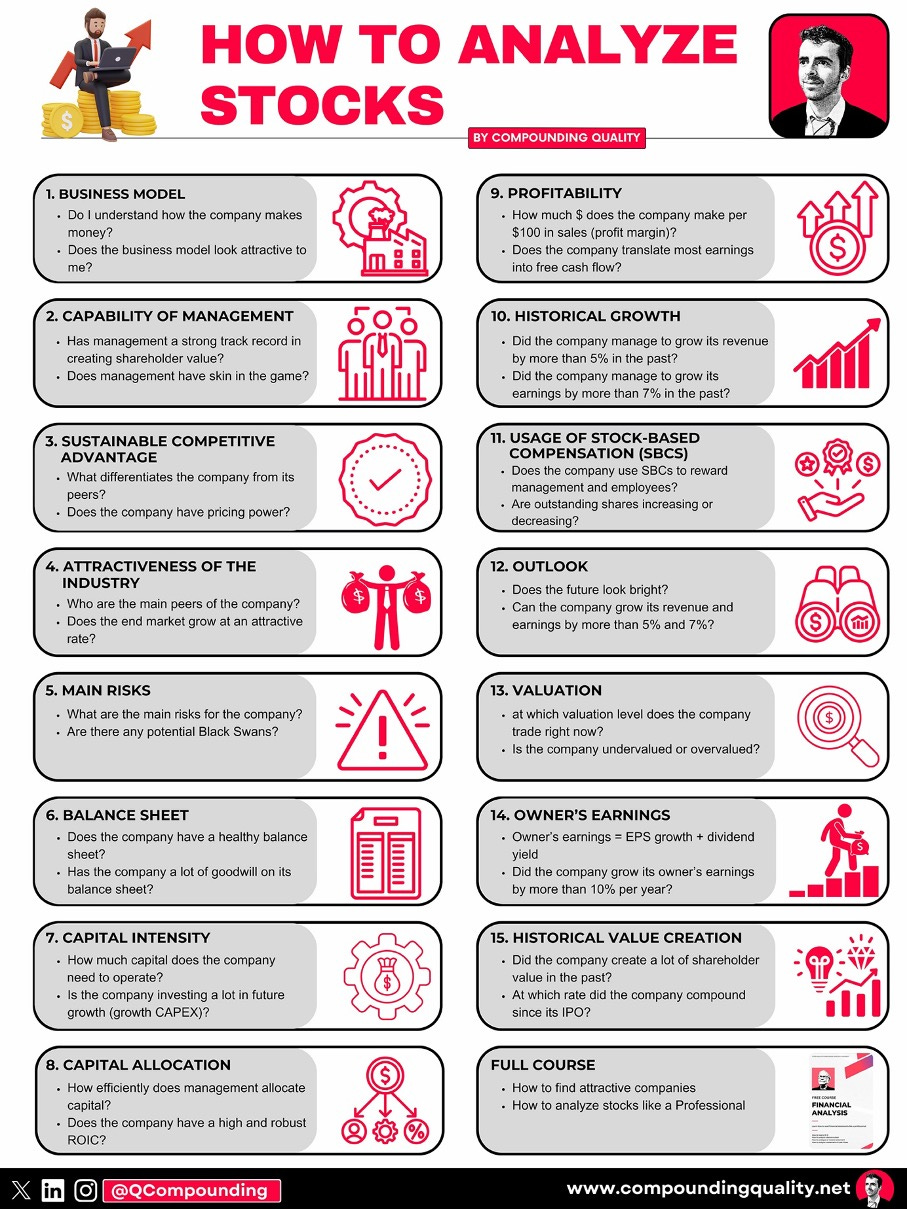
Now let’s use our 15-step approach to analyze the company.
At the end of this article, we’ll give Zoetis a score on each of these 15 metrics.
This results in a Total Quality Score.
1. Do I understand the business model?
Do you have a pet? I have a dog and chances are very likely you have one too.
70% of households in the U.S. have a pet. If you do, Zoetis has probably made money from you without you even realizing it.
How? They operate as a leading animal health company.
Their mission is simple:
“Our commitment at Zoetis is to ensure that animals live longer, healthier lives, ultimately enhancing the lives of the people who depend on them.” — Kristin Peck (CEO)Born as a spinoff from Pfizer in 2013, Zoetis has become one of the market leaders.
Zoetis currently owns 15 blockbuster products. These products generate over $100 million in revenue every single year.
The key lesson from this?
Zoetis owns a well-diversified product portfolio full of winners.
And usually, winners tend to keep on winning.
Zoetis makes money in 2 ways:
Livestock Revenue (32.2%): Products designed for animals raised for meat, milk, and other agricultural purposes
Companion Animal Revenue (67.8%): Goods created specifically for your loved pets. Think of Apoquel for example, a treatment for itching and allergies for dogs
As you can see, the Companion Animal Revenue is the most important for Zoetis:

2. Is management capable?
Why management is so important?
In the long term, it’s the people and culture of the company that drive investment results.

Kristin Peck has been Zoetis’ CEO since 2020.
Her resume speaks for itself:
Earlier in her career, she held (executive) roles at the Boston Consulting Group (BCG) and Pfizer
Ms. Peck serves on the boards of BlackRock, Columbia Business School, Mayo Clinic, and Catalyst
In 2020, Fortune named her Businessperson of the Year
In 2022, Barron’s recognized her as one of the top CEOs
She was named to CNBC's 2024 Changemakers list
We love seeing her being active in a non-profit (Catalyst). This could be an indication of high integrity.
She directly owns 80,160 shares, resulting in a stake of $14.7M.
Insiders own 0.07% or $56.2M worth of shares.
Although insider ownership is limited, management has a strong track record in creating shareholder value.

3. Does the company have a sustainable competitive advantage?
Zoetis has 3 main competitive advantages:
As Zoetis is the largest player in the industry, it benefits from economies of scale
The know-how, expertise, and track record in research and development (R&D) play a significant role in creating a competitive edge
High barriers to entry: law, regulations, and high investments in R&D make it tough to enter the market
Zoetis has proven to defend itself from competitors.
But there’s more.
Zoetis can also defend itself from economic recessions.
Pets are like family now. Even in tough times, people won’t spend less on their pets.
Companies with a sustainable competitive advantage are often characterized by the following:
Gross Margin: 70.1% (Gross Margin > 40%? ✅)
Return On Invested Capital (ROIC) 24.0% (ROIC > 15%? ✅)

4. Is the company attractive in an interesting end market?
The end market is expected to grow at a CAGR of 9.0% in the coming years.
The pet industry is in a clear secular trend:
The life expectancy of pets is growing quicker than ours
According to studies, 95% of people see their pet as a full family member. This trend is called humanization. And when pets are family, we spend more on them
The pet population is growing way faster than humans. Here are the growth rates from 2010 to 2023:
Humans: +14%
Dogs: +45%
Cats: +67%
More and more people are choosing pets over a partner or children
The rising global population is driving an increasing demand for animal proteins
The pet industry is currently flying like a bird in the sky, and Zoetis has proven that it can grow faster than the industry.

5. What are the main risks for the company?
The medicine industry is characterized by some risks:
Pfizer still owns complete patents of Zoetis’ products, which makes Zoetis (too) dependent
Laws and regulations: The costs of making new medicines are very high. They need to pass lots of tests, and potential lawsuits can cause big problems
In general, these are the key risks for Zoetis:
The livestock segment faces greater cyclicality
Expiring patents could weaken Zoetis' competitive edge
R&D pipeline failures could limit Zoetis' growth prospects
What’s also important? There are always risks that you simply can’t predict.
"Risk is what’s left after you thought of everything." - Carl Richards6. Does the company have a healthy balance sheet?
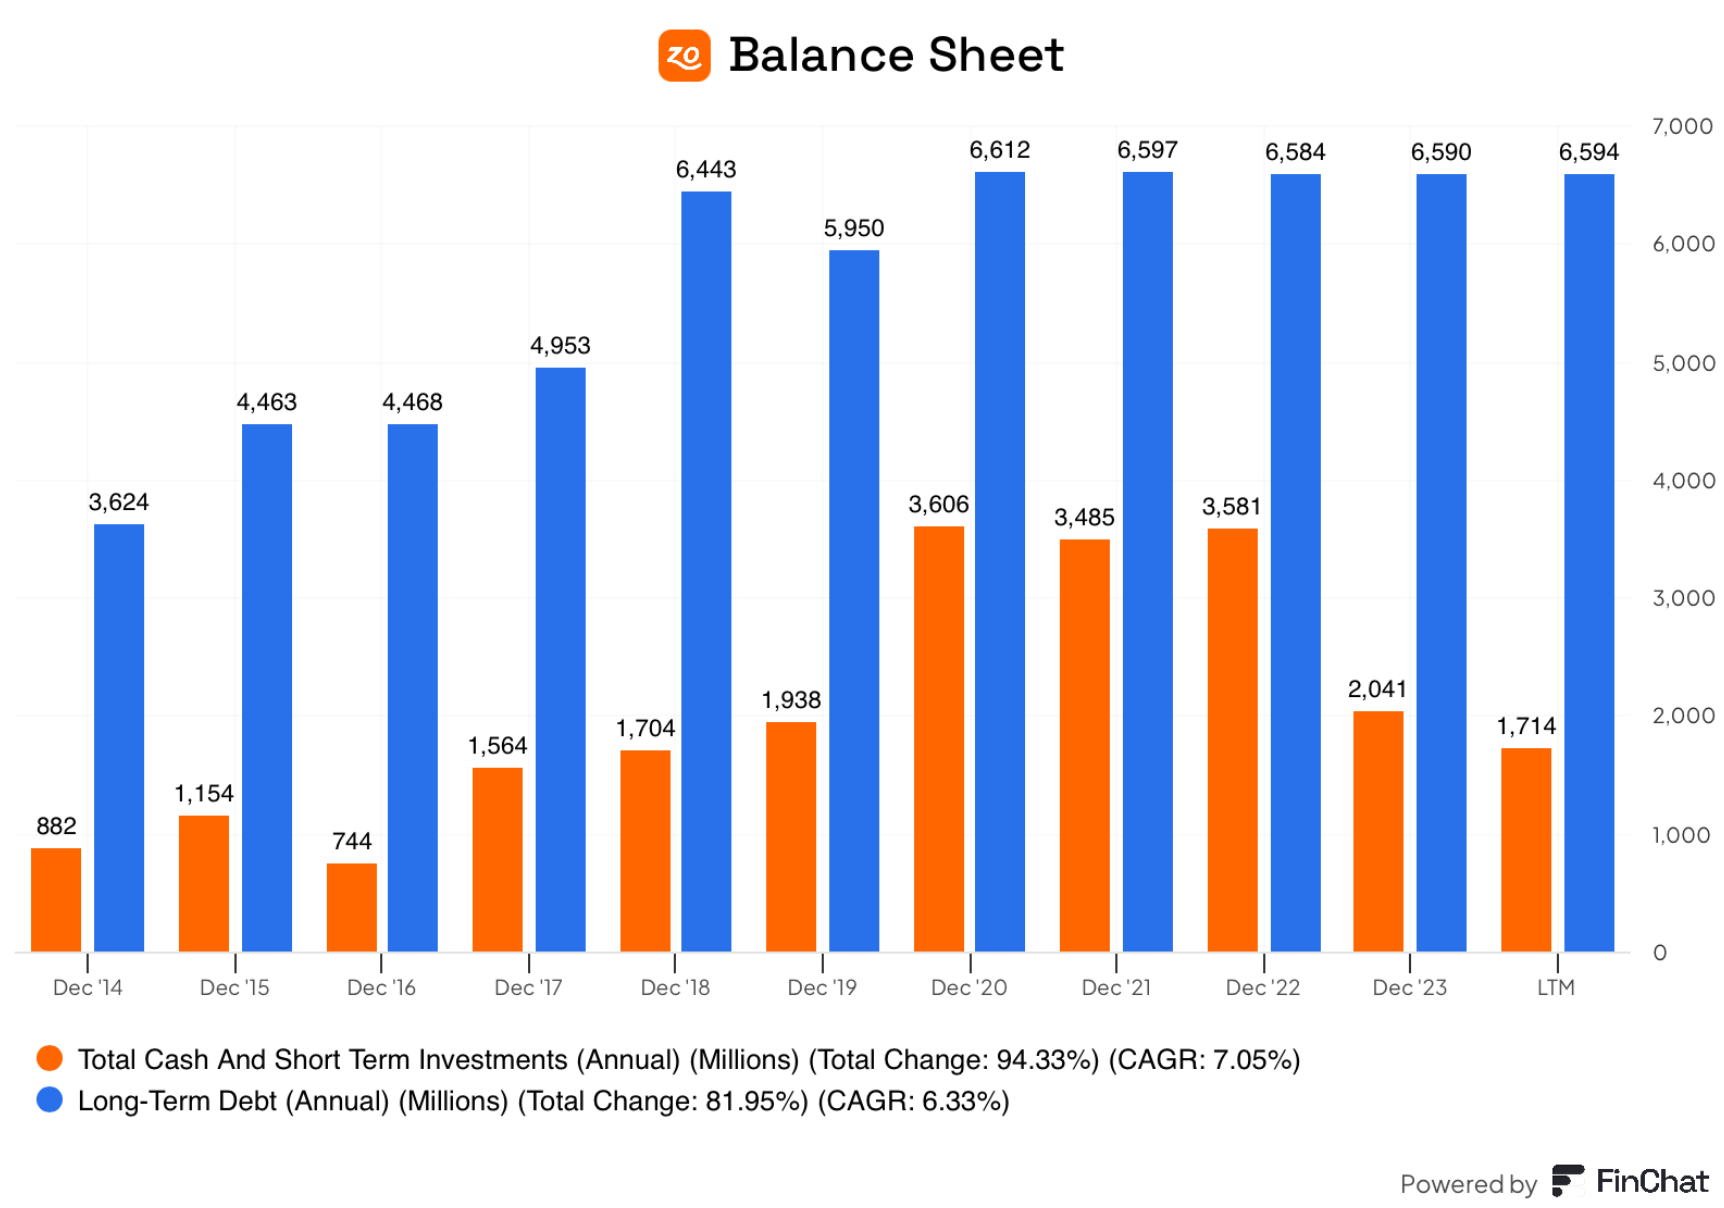
We look at three ratios to determine the healthiness of the balance sheet:
Interest coverage: 14.3x (interest coverage > 15x? ❌)
Net Debt/FCF: 2.1x (Net Debt/FCF < 4x? ✅)
Goodwill/Assets: 19.1% (Goodwill to assets < 20%? ✅)
Zoetis has a healthy balance sheet.
7. Does the company need a lot of capital to operate?
The less capital a business needs to operate, the better
Here’s what things look like for Zoetis:
CAPEX/Sales: 7.0% (CAPEX/Sales? < 5%? ❌)
CAPEX/Operating cash flow: 21.6% (CAPEX/Operating CF? < 25%? ✅)
But not all spending is the same. Here's the difference:
Maintenance CAPEX: This is the money a company spends to fix or keep its current assets (like machines or buildings) working properly
Growth CAPEX: This is the money a company spends to buy new things so it can grow bigger and do more
Total CAPEX = Maintenance CAPEX + Growth CAPEX
If a company is spending a lot to grow, it might seem like they require a lot of capital. But in the future, these investments might help them make a lot more money!
For some companies (like Zoetis), it’s better to focus on just the Maintenance CAPEX to understand their spending. A simple way to guess Maintenance CAPEX is to use Depreciation & Amortization as a proxy.
Maintenance CAPEX/Sales: 4.6% (CAPEX/Sales? < 5%? ✅)
Maintenance CAPEX/Operating cash flow: 14.4% (CAPEX/Operating CF? < 25%? ✅)
These figures look good.
8. Capital allocation
Capital allocation is the most important task of management.
We are looking for businesses that allocate the resources of shareholders effectively.
Zoetis:
Return on equity (ROE): 47.1% (ROE > 20%? ✅)
Return on Capital (ROIC): 24.0% (ROIC > 15%? ✅)
Here’s an evolution of Zoetis’s ROE and ROIC:
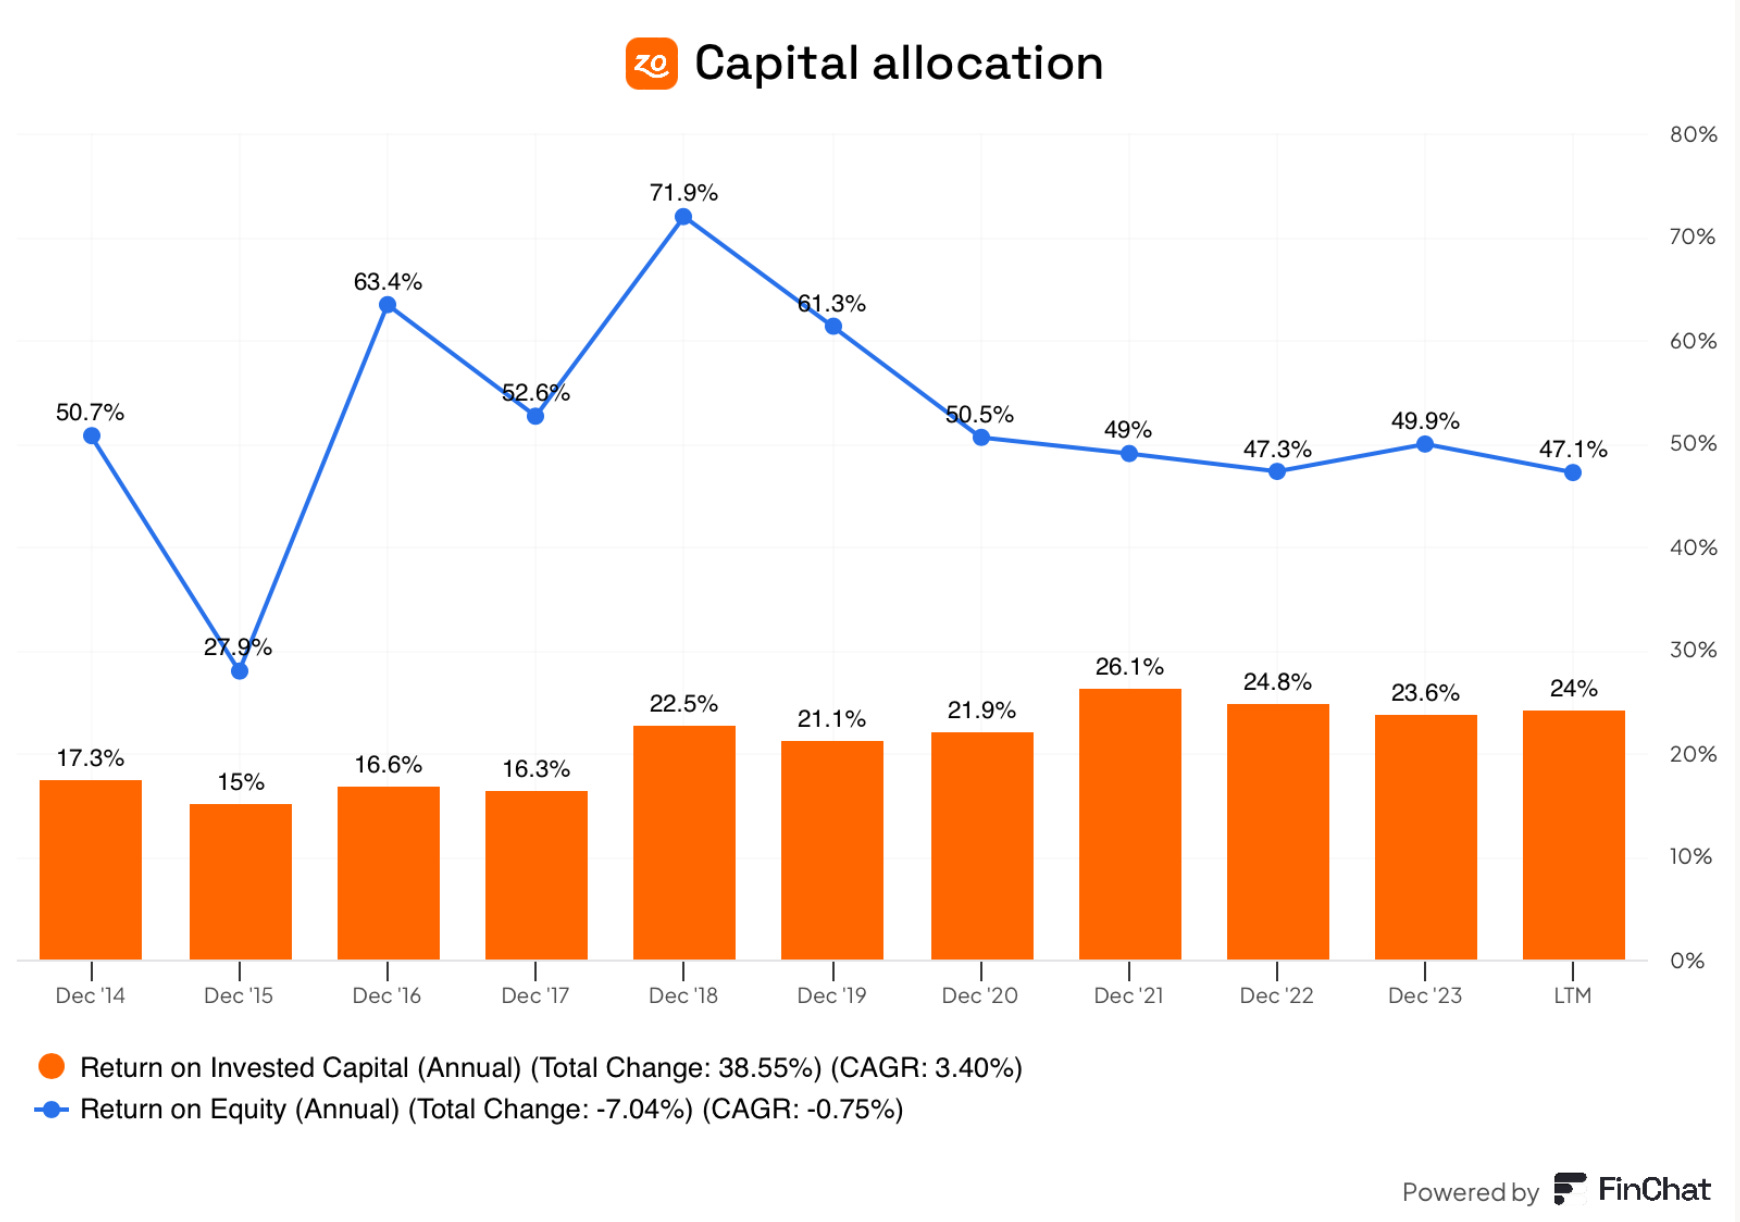
The increase in ROIC since 2020 shows that the new CEO is delivering great results.
9. How profitable is the company?
The higher the profitability of the business, the better.
Here’s what thing looks like for Zoetis:
Gross margin: 70.1% (Gross margin > 40%? ✅)
Net Profit Margin: 26.6% (Net Profit Margin > 10%? ✅)
FCF/Net income: 95.0% (FCF/Net income > 80%? ✅)
Zoetis is a cash cow. Got the joke?

An increasing Gross Margin is a strong indicator of pricing power. This is the case for Zoetis.
10. Does the company use a lot of Stock-Based compensation?
Stocks-based compensation is a cost for shareholders and should be treated accordingly.
Preferably, we want SBCs as a % of Net Income to be lower than 10%.
Zoetis:
SBCs of a % of Net Income: 3.0% (SBSs/Net income < 10%? ✅)
Avg. SBC as a % of Net Income past 5 years: 3.0% (SBCs/Net income < 10%? ✅)
Zoetis does not use a lot of Stock-Based Compensation, which is positive to see as an investor.
11. Did the company grow at attractive rates in the past?
Let’s look at what the recent history tells us:
Revenue growth past 5 years (CAGR): 8.3% (revenue growth > 5%? ✅)
Revenue growth past 10 years (CAGR): 6.9% (revenue growth > 5%? ✅)
EPS growth past 5 years (CAGR): 12.0% (EPS growth > 7%? ✅)
EPS growth past 10 years (CAGR): 16.9% (EPS growth > 7%? ✅)
The animal health leader has grown at attractive rates in the past.

12. Does the future look bright?
Let’s look at what the estimates are:
Exp. Revenue growth next 2 years (CAGR): 6.7% (revenue growth > 5%? ✅)
Exp. EPS growth next 2 years (CAGR): 9.8% (revenue growth > 7%? ✅)
Long-term growth estimate EPS (CAGR): 8.9% (EPS growth > 7%? ✅)
This outlook looks attractive.
13. Does the company trade at a fair valuation level?
We always use three methods to look at the valuation of a company:
A comparison of the Forward PE multiple with its historical average
Earnings Growth Model
Reverse Discounted-Cash Flow
A comparison of the Forward PE multiple with its historical average
The first thing we do is compare the current forward PE with its historical average over the past 10 years.
This is a shortsighted method but it already gives a quick indication.
Today, Zoetis trades at a forward PE of 27.1x compared to a historical average of 30.5x.

Earnings Growth Model
This model shows you the yearly return you can expect as an investor.
Here are the assumptions I use:
EPS growth: 10% per year over the next 10 years
Dividend Yield: 1%
Forward PE to decline from 27.1X to 25.0x
Expected yearly return = 10% + 1% + 0.1((25.0x – 27.1x)/27.1x)) = 10.2%
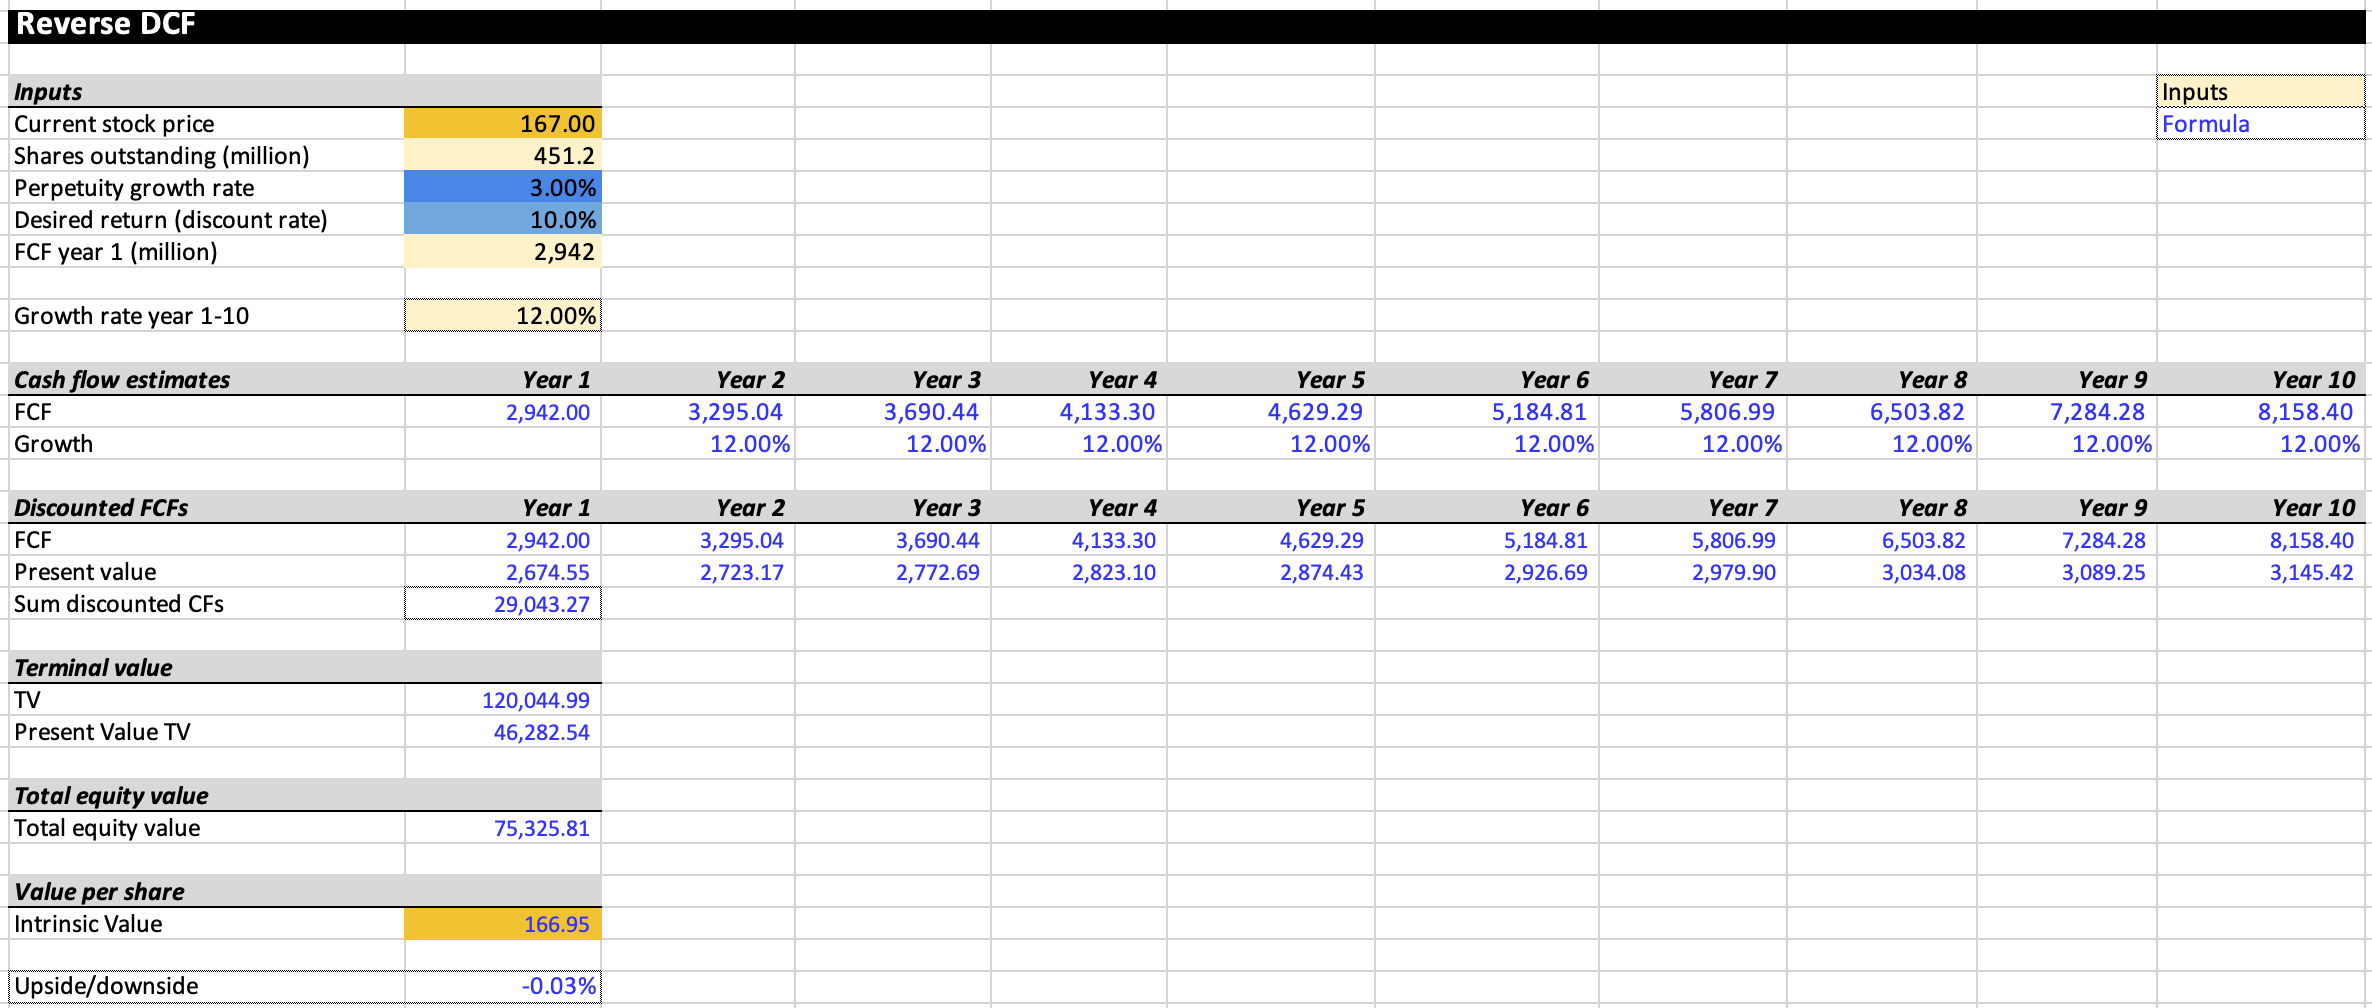
Reverse DCF
Charlie Munger once said that if you want to find a solution to a complex problem, you should invert. Turn the problem upside down.
This is exactly what a reverse DCF does. As an investor, we don’t make assumptions. We simply look at what assumptions the market has made and see whether they are reasonable.
The expected free cash flow of the next 12 equals $2.630 billion.
We subtract the Stock-Based Compensation ($72 million) and add Growth CAPEX ($384 million) to arrive at FCF in year 1 of $2.942 billion.
The reverse DCF indicates that Zoetis should grow its FCF by 12.0% each year for the coming 10 years. This is definitely not cheap, but Zoetis might be able to achieve this.
Zoetis:
Forward PE: 27.1x (lower than its 10-year average? < 30.5x? ✅)
Earnings Growth Model: 10.2% (Yearly return? < 10%? ✅)
FCF-Growth Reverse DCF: 12.0% (Realistic growth expectations? ❓)
14. How did Owner’s-Earnings evolve in the past?
Over time, stock prices tend to follow the Owner’s Earnings of the company (EPS Growth + Dividend Yield)
That’s why we want to invest in companies that managed to grow their Owner’s Earnings at attractive rates in the past. This is certainly the case for Zoetis.
Zoetis:
CAGR Owner’s Earnings (5 years): 13.0% (CAGR Owner’s Earnings > 12%? ✅)
CAGR Owner’s Earnings (10 years): 17.5% (CAGR Owner’s Earnings > 12%? ✅)
15. Did the company create a lot of shareholder value in the past?
We want to invest in companies that managed to compound at attractive rates in the past.
Ideally, the company returned more than 12% per year to shareholders since its IPO.
Here’s what the performance of Zoetis looks like:
YTD: -15.0%
5-year CAGR: +6.3%
CAGR since IPO in 2013: +16.1% (CAGR since IPO > 12%? ✅)

Quality Score
Finally, let’s bring everything together and give the company a Total Quality Score.
As you can see in the table below, Zoetis gets a Total Quality Score of 8.1/10

The lesson from today? Zoetis is a wonderful business that deserves a spot on our watch list.
We would love to pick up the company at (slightly) lower valuation levels.
The most interesting stocks? The ones in Our Portfolio of course. If you aren’t a Partner, consider becoming one to get access to My Personal Portfolio right away.
Used sources
Interactive Brokers: Portfolio data and executing all transactions
Finchat: Financial data