

Jason Zweig once said:
“I put two children through Harvard by trading options. Unfortunately, they were my broker’s children.” Today, we’ll look at the broker I use: Interactive Brokers.

Interactive Brokers - General information
👔 Company name: Interactive Brokers
✍️ ISIN: US45841N1072
🔎 Ticker: IBKR
📚 Type: Owner-Operator
📈 Stock Price: $157.9
💵 Market cap: $66.7 billion
📊 Average daily volume: $143 million
Onepager
Here’s a onepager with the essentials of Interactive Brokers:

15-Step Approach
Now, let’s use our 15-step approach to analyze Interactive Brokers.
At the end of this article, we’ll give Interactive Brokers a score on each of these 15 metrics.
This results in a Total Quality Score.

How we use Interactive Brokers
Before we discuss the investment case, it’s important to understand that I execute all my transactions through Interactive Brokers.

As you can see, our CAGR is significantly better than the S&P 500:

The screenshot above is the official track record from my account. If you want to explore more, you can find everything you need to know about Interactive Brokers here.
1. Do I understand the business model?
Interactive Brokers is an American online broker with over 3.6 million client accounts.
The company lets investors buy and sell almost any asset through its electronic platforms. It offers products from over 150 exchanges.
The company makes money in two ways:
Interest income (60.5%): The interest income is earned on the cash reserves of around $100 billion that clients hold in their accounts
Interactive Brokers invests these reserves into debt securities and margin loans. They pay a slightly smaller rate to their customers, generating a spread on these cash reserves
Sounds like a bank? Yes! But there are some important differences to banking, on which we will come back later
Non-interest income (39.5%): All commissions and fees clients pay for using the brokerage platform
For example, if you submit a buy order to Interactive Brokers, you pay a small commission to the company for executing this order
The company is active in almost 200 countries, but most of its revenue (69%) is generated in the US.

Interactive Brokers serves all types of customers. This ranges from individual investors to large hedge funds.

The best way to analyze a stock? Explore it yourself.

You can take a look at Interactive Brokers here.
2. Is management capable?
Thomas Peterffy founded the company in 1977. He arrived in the United States as a Hungarian migrant in 1965.
It’s great seeing Peterffy is still the Chairman.
Only 25.8% of the company is publicly held. The remainder is owned by IBG Holdings LLC, which is 91.4% owned by Thomas Peterffy and his affiliates.
This means we’re talking about an Owner-Operator Stock.
Milan Galik, the current CEO, took over the executive role from Mr. Peterffy in 2019. He has been with IBKR since 1990.
Many top leaders have been at the company for a long time. For example, the Vice Chairman joined in 1988, the CFO in 1987, and the Chief Information Officer in 1985.

3. Does the company have a sustainable competitive advantage?
Interactive Brokers has a wide moat based on cost advantages.
The company has an extreme focus on efficiency, technology, and automation. This leads to profit margins far exceeding those of competitors.
They also have something in common with Amazon that few other businesses have: An extreme customer focus.
How? It offers rates on cash reserves that exceed competitors’ rates by far:

The company is very transparent to its customers regarding costs, in contrast to many other (online) brokers
It doesn’t sell order flow to market makers, even though doing so could make the company more money in the short term. This choice saves customers money.
“The most important single thing is to focus obsessively on the customer.”
- Jeff Bezos
Companies with a sustainable competitive advantage typically show a high and strong Gross Margin and ROIC.
Interactive Brokers:
Gross Margin: 90.7% (Gross Margin > 40%? ✅)
ROIC: 22.4% (ROIC > 15%? ✅)

4. Is the company active in an attractive end market?
Interactive Brokers (IBKR) benefits from key trends in asset management.
First, global investment levels keep rising: almost $30 trillion is managed by mutual funds today.
Three major trends support IBKR’s growth:
More hedge funds: Assets in hedge funds grew from $118 billion in 1997 to over $5 trillion today. These funds use complex strategies that need advanced tools and data, exactly what IBKR offers with features like its option strategy builder and volatility lab.
More ETFs: The number of ETFs has exploded from 276 in 2003 to nearly 9,000 in 2022. These cost-sensitive funds often choose low-cost platforms like IBKR for trading.
More retail investors: In 2021, retail investors managed 52% of the global invested money. Many are under 35, tech-savvy, data-driven, and cost-aware — a perfect match for IBKR’s platform.
5. What are the main risks for the company?
There are three key risks to understand about Interactive Brokers.
1. Is IBKR a bank?
Some people consider Interactive Brokers a bank because they receive quite some interest income.
This can be seen as a risk since banks are greatly affected by interest rates.
The comparison makes sense, but some differences are important to keep in mind:
Interest Rates: IBKR isn’t as affected by rising interest rates because it only invests clients’ cash in short-term assets.
Leverage: Customers who want to borrow money to invest need to put up a lot of collateral.
Assets: About 99% of IBKR’s assets are liquid, making a situation like Silicon Valley Bank's collapse unlikely when interest rates rise.
2. What to do when interest rates fall?
The graph below shows a connection between the average earnings IBKR gets from customer cash and the interest rate set by the central bank.

If interest rates fall, IBKR earns a little less from interest. Some analysts on Wall Street, who often think short-term, might lower their price targets and recommendations.
3. Future of the company’s management?
CEO Milan Galik (57) and Chairman Thomas Peterffy (79) might soon start thinking about who will succeed them.
Although no names are known yet, the company has a great track record of keeping people inside the firm for a long time and preparing them for further roles.
6. Does the company have a healthy balance sheet?
We look at three ratios to determine the healthiness of Interactive Brokers’ balance sheet:
Interest Coverage: / (Interest Coverage > 15x? 🤷♀️)
Net Debt/FCF: Net Cash Position equal to 43.6% (!) of Total Assets (Net Debt/FCF < 4x? ✅)
Goodwill/Assets: 0% (Goodwill/Assets not too large? < 20% ✅)
Interactive Brokers has a very healthy balance sheet.

7. Does the company need a lot of capital to operate?
We prefer to invest in companies with CAPEX/Sales lower than 5% and CAPEX/Operating Cash Flow lower than 25%.
Interactive Brokers:
CAPEX/Revenue: 0.9% (CAPEX/Sales < 5%? ✅)
CAPEX/Operating Cash Flow: 0.6% (CAPEX/Operating CF? < 25% ✅)
As you can see, Interactive Brokers has a very low capital intensity.

Why is the CAPEX/Operating Cash Flow so close to the CAPEX/Revenue? Are Sales and Operating Cash Flow virtually the same?
Yes. This is because increases in client cash reserves are seen as operating cash flows.
Every time a client deposits money into their Interactive Brokers account, the company boosts its operating cash flow..
It compensates for all costs that are deducted from revenue to obtain profits.
8. Is the company a great capital allocator?
Capital allocation is the most important task of management.
Look for companies that invest shareholders' money at attractive rates of return.
Interactive Brokers:
Return On Equity (ROE): 4.9% (ROE > 20%? ❌)
Return On Invested Capital (ROIC): 22.4% (ROIC > 15%? ✅)
Interactive Brokers seems to be operating at a very attractive ROIC.

9. How profitable is the company?
The higher the profitability of the company, the better.
Here’s what things look like for Interactive Brokers:
Gross Margin: 90.7% (Gross Margin > 40%? ✅)
Net Profit Margin: 14.5% (Net Profit Margin > 10%? ✅)
Interactive Brokers’ profitability looks very attractive. They have a very scalable business model.

10. Does the company use a lot of Stock-Based compensation?
Stock-based compensation is a cost for shareholders and should be treated accordingly.
Preferably, we want SBCs as a % of Net Income to be lower than 4% and certainly below 10%.
Interactive Brokers:
SBCs as a % of Net Income: 15.2% (SBCs/Net Income < 10%? ❌)
Avg. SBC as a % of Net Income past 5 years: 32.5% (SBCs/Net Income < 10%? ❌)
Interactive Brokers uses a lot of Stock-Based Compensation. We will treat this as a cost in our valuation model.
11. Did the company grow at attractive rates in the past?
We look for companies that managed to grow their revenue and EPS by at least 5% and 7% per year, respectively.
Interactive Brokers:
Revenue Growth past 5 years (CAGR): 22.0% (Revenue growth > 5%? ✅)
Revenue Growth past 10 years (CAGR): 15.8% (Revenue growth > 5%? ✅)
EPS Growth past 5 years (CAGR): 28.6% (EPS growth > 7%? ✅)
EPS Growth past 10 years (CAGR): 24.6% (EPS growth > 7%? ✅)
These growth figures look attractive.
Another positive? The number of client accounts has been growing at a CAGR of 23% since 2008.
12. Does the future look bright?
You want to invest in companies that manage to grow at attractive rates, as stock prices tend to follow FCF per share growth over time.
Interactive Brokers:
Exp. Revenue Growth next 2 years (CAGR): 5.1% (Revenue growth > 5%? ✅)
Exp. EPS Growth next 2 years (CAGR): 5.7% (EPS growth > 7%? ❌)
EPS Long-Term Growth Estimate: 10.5% (EPS growth > 7%? ✅)
13. Does the company trade at a fair valuation level?
We always use 3 methods to look at the valuation of a company:
A comparison of the forward P/E multiple with its historical average
Earnings Growth Model
Reverse Discounted-Cash Flow
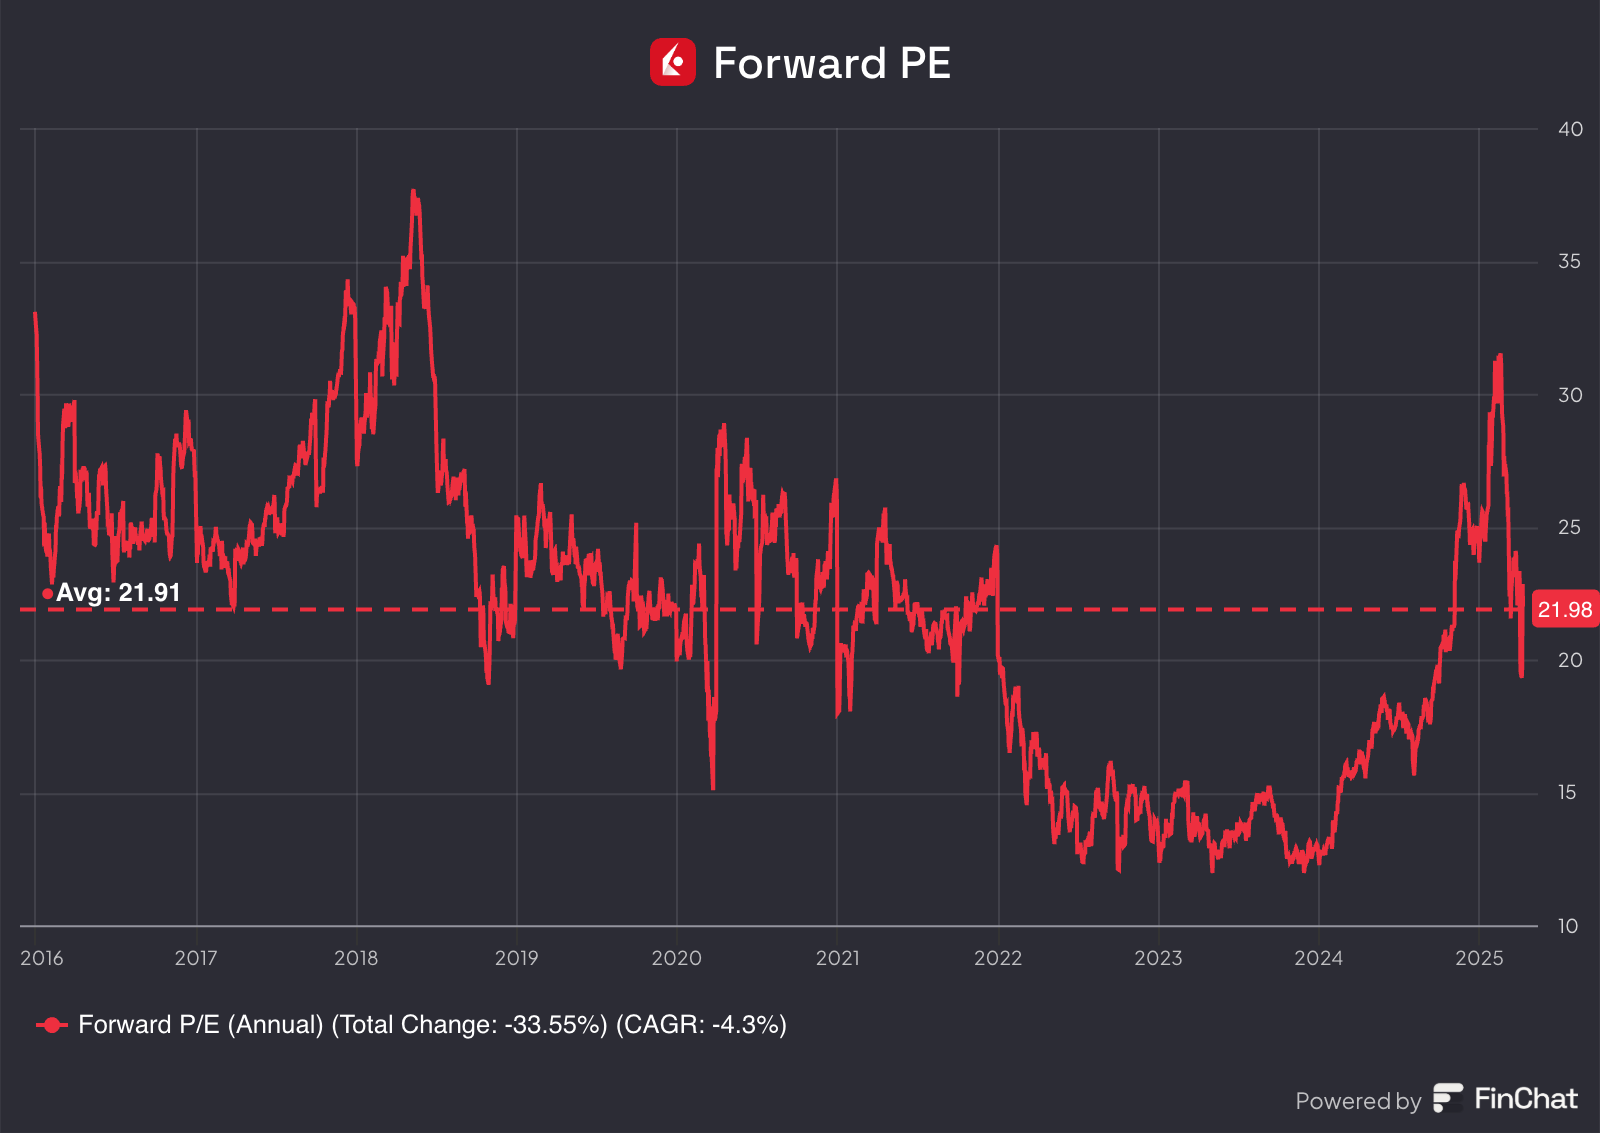
A comparison of the multiple with the historical average
The first thing we do is compare the current forward PE with its historical average.
Today, Interactive Brokers trades at a Forward PE of 22.0, the same as its 10-year average.
Earnings Growth Model
This model shows you the yearly return you can expect as an investor.
In theory, it’s easy to calculate your expected return:
Expected return = EPS Growth + Dividend Yield +/- Multiple Expansion (Contraction)
Here are the assumptions I use:
Earnings per Share Growth: 12.0% per year over the next 10 years
Dividend yield: 0.5%
Forward PE to remain flat
Expected yearly return = 12.0% + 0.5% + 0.0% = 12.5%
Reverse DCF
Charlie Munger once said that if you want to find the solution to a complex problem, you should invert. Always invert. Turn the problem upside down.
A reverse DCF shows you the expectations implied in the current stock price.
You try to determine for yourself whether these expectations are realistic or not.
You can learn more about a reverse DCF here: Reverse DCF 101.
For this model, we should use Net Income instead of Free Cash Flow, as client cash reserves are wrongfully taken into account for the Free Cash Flow.
The expected Net Income of the next 12 months equals $755 million.
We subtract the Stock-Based Compensation ($122 million) to arrive at FCF in year 1 of $721.5 million.
Today, IBKR has 108.9 million shares outstanding.
Under these assumptions, our Reverse DCF indicates that Interactive Brokers should grow its Net Income by 12.9% per year to return 10% per year to shareholders.

Interactive Brokers:
Forward PE: 22.0x (lower than its 5-year average? < 22.0x? 🤷♀️)
Earnings Growth Model: 12.5% (Yearly return > 10%? ✅)
Net Income Growth Reverse DCF: 12.9% (Realistic growth expectations? 🤷♀️)
14. How did the Owner’s earnings of the company evolve in the past?
Over time, stock prices usually follow the growth in a company's Owner’s Earnings (EPS Growth + Dividend Yield).
That’s why we want to invest in companies that managed to grow their Owner’s Earnings at attractive rates in the past.
This is the case for Interactive Brokers:
CAGR Owner’s Earnings (5 years): 29.3% (CAGR Owner’s Earnings > 12%? ✅)
CAGR Owner’s Earnings (10 years): 25.1% (CAGR Owner’s Earnings > 12%? ✅)
15. Did the company create a lot of shareholder value in the past?
We want to invest in companies that have compounded at attractive rates in the past.
Ideally, the company has returned more than 12% per year to shareholders since its IPO.
Here’s what the performance of Interactive Brokers looks like:
YTD: -13.5%
5-year CAGR: +28.8%
CAGR since IPO (2007): +11.4% (CAGR since IPO > 12%? ❌)

The main reason IBKR hasn’t returned more than 12% per year since their IPO?
After the IPO in 2007, the share price needed a lot of time to recover from the 2008 Big Financial Crisis, only reaching its IPO level in 2015.
Since then, the stock has been picked up again, performing well above the market’s return.
Quality score
Finally, let’s bring everyhing together and give Interactive Brokers a Total Quality Score.