

Honesty and transparency are fundamental to me.
They are the building blocks of high integrity.
That’s why I should confess that I made a mistake…

I am thinking about launching an exclusive series about Tiny Compounders.

Those are Micro Cap Quality Stocks with tremendous upside potential.

It uses exactly the same philosophy as Compounding Quality, but focuses on very small companies. Think about trying to invest in Apple twenty years ago.

Please note that we'll never write about these companies via Compounding Quality (and they are not in our coverage) as we would influence the stock price too much.

Because these companies are so small, the series will be very exclusive. Maximum 200 people will be allowed and it will be quite expensive.

If you are interested, you can put yourself on the waiting list here.Why I’m Done Buying Small Caps
Monday (17 February), I wanted to buy a new high-quality compounder for Our Portfolio.
(You can read the announcement here)
Unfortunately, my limit order (GBP 80) didn’t go through because the stock rose significantly on the buy announcement. That day, the stock went up over 10% intraday.

The reason for this price increase wasn’t the right one. The company didn’t report earnings, acquire a new business, or make any other fundamental change.
The increase was due to our announcement.
I don’t want this to happen again.
That’s why I am considering not buying Small Caps anymore.
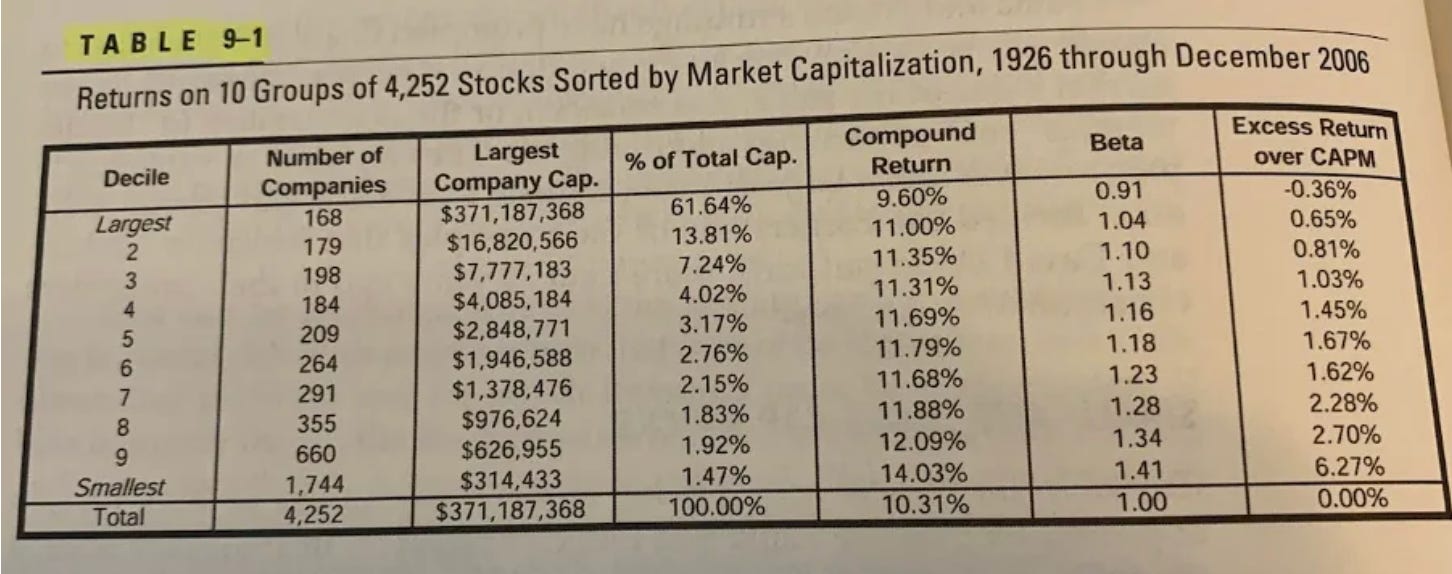
This wouldn’t be great news. Small Caps have the potential to be life-changing investments. As you might know, the best-performing stock in Our Portfolio is a Small Cap.
On average, Small Caps outperform the market by 3.7%.
I still want to provide you with high-quality Small Caps without influencing the price too much.
That’s why I launched this new series…
Small Cap Of The Month
In this new series, we’ll introduce you to high-quality small businesses.
These companies can be great investments, but they might be too small to buy for Compounding Quality.
Our idea this month? Harvia.
Harvia - General Information
👔 Company name: Harvia
✍️ ISIN: FI4000306873
🔎 Ticker: HEL:HARVIA
📚 Type: Oligopoly
📈 Stock Price: 46.9 EUR
💵 Market cap: 875 million EUR
📊 Average daily volume: 1.3 million EUR

1. How does Harvia make money?
Finland is famous for its stunning nature, being the happiest country in the world, and its sauna culture.
Harvia plays a big role in this. This Finnish company is the global leader in the sauna and spa market.
Recently, Harvia expanded to the US by acquiring ThermaSol, a steam room manufacturer.
Harvia’s management strongly believes in acquisitions like ThermaSol.
The sauna and spa market is highly fragmented, making expansion through acquisitions interesting.
To some extent, it can be seen as a serial acquirer.
What about Harvia’s moat? The company has a 75-year history, proving its resilience. Its strong brand and reputation deepen their moat.
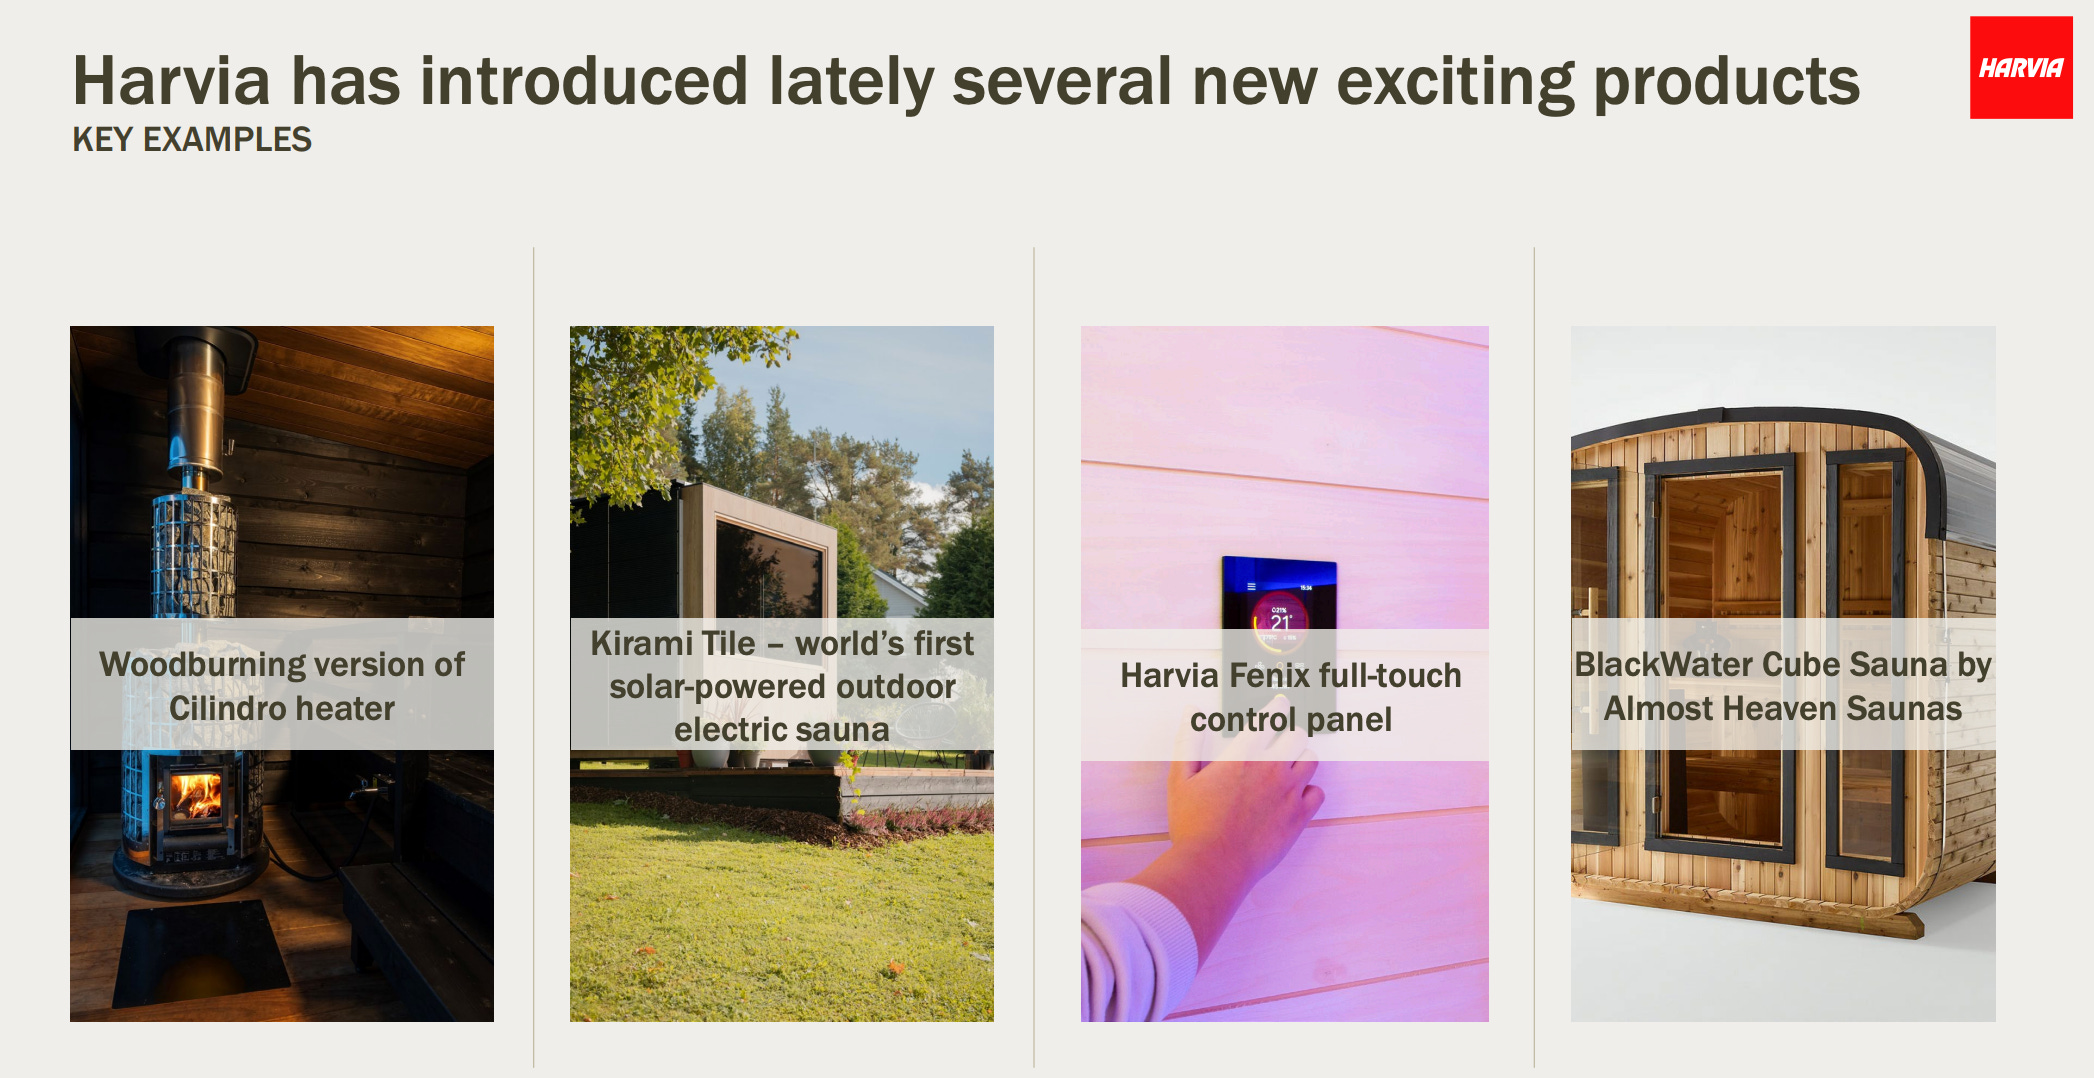
Harvia makes money in five ways:
Heating Equipment (53%) includes both electric and wood-burning sauna heaters
Saunas & Hot Tubs (25%) covers complete sauna cabins and outdoor hot tubs
Steam Products (9%) features steam generators and related accessories
Accessories & Heater Stones (7%) includes essential sauna additions such as sauna stones
Spare Parts & Services (6%) covers replacement parts and maintenance
The sauna market is expected to grow at a CAGR of 5.0% in the coming years.
2. Management
Matias Järnefelt became Harvia’s CEO in 2023.
Interestingly, while Harvia discloses the number of shares its executives own, it does not provide this information for the CEO.
In an ideal world, we would like to have this information.
Before joining Harvia, Matias gained experience at Nokia Corporation.
The company’s CFO, Ari Vesterinen, holds 149,664 shares, currently valued at roughly €7.0 million.
Overall, insider ownership stands at 6.1%.

3. Fundamentals
Let’s dive into the numbers.
Right away, one figure stands out, the high Return On Invested Capital.
As a quality investor, I always begin by evaluating a company’s capital allocation skills.
In Harvia’s case, a Return on Invested Capital (ROIC) of 17.0% is a strong indicator of efficiency.

A high ROIC often suggests a company can turn its investments into solid earnings.
Let’s put that theory to the test.
As you can see, Harvia has proven to be highly profitable, with a strong track record of growing Net Income.
However, it’s also clear that the company has faced some recent challenges.

The main reason? The impact of the war in Ukraine. Harvia has exited its operations in Russia.
Despite this setback, it’s good to see Harvia has found its way back to growth.
That’s it for the Income Statement.
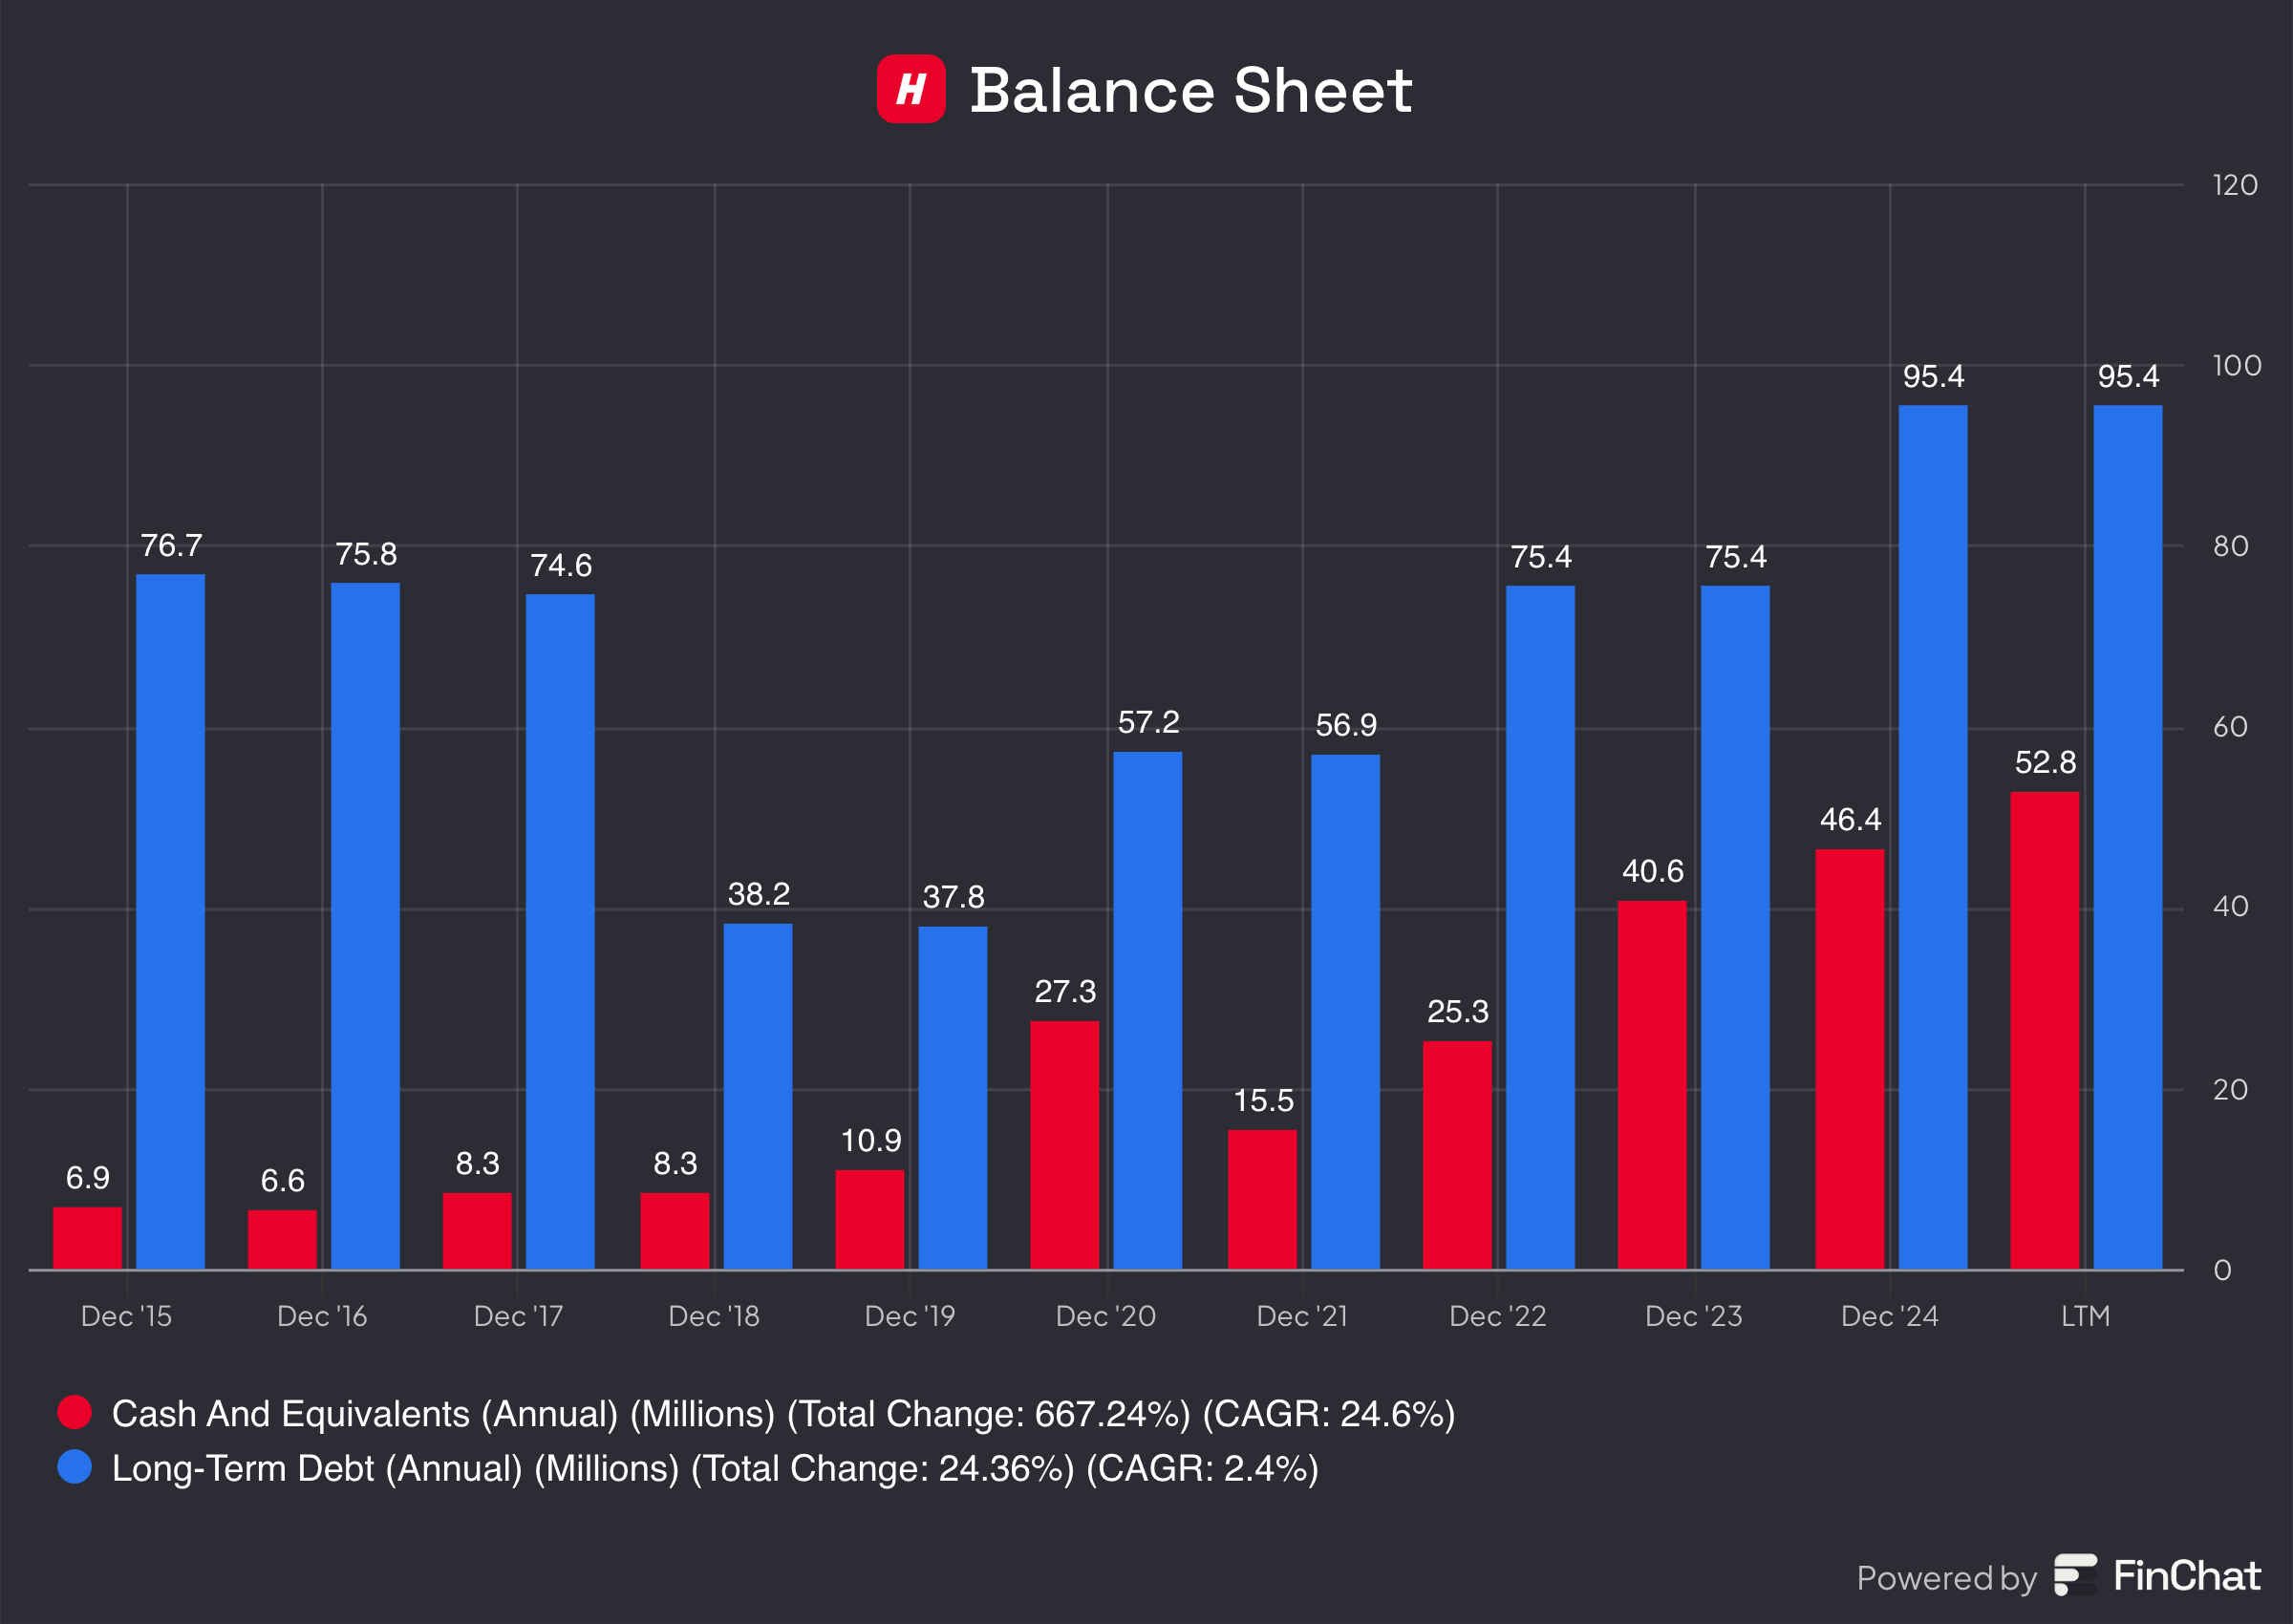
Let’s now take a look at the Balance Sheet.
I always use the following ratios to determine how healthy the Balance Sheet is:
Interest coverage: 7.8x (Interest Coverage > 15x? ❌)
Net Debt/FCF: 2.2x (Net Debt/FCF < 4x? ✅)
Goodwill/Assets: 33.0% (Goodwill to assets < 20%? ❌)
The higher Goodwill is normal because of the acquisitions.
Harvia has a healthy Balance Sheet, but in an ideal world, we like to see a higher Interest Coverage.
Finally, there’s the Cash Flow Statement.
When analyzing a Cash Flow Statement, I focus on three key numbers.
First, there’s Stock-Based Compensation.
Some companies use this method to reward employees, but Harvia takes a different approach. It doesn’t rely on stock-based incentives at all, which is great to see.
Next, I look at Earnings Quality, which measures how efficiently a company converts Net Income into Free Cash Flow.
As a rule of thumb, I want Free Cash Flow/Net Income to be higher than 80.0%. Harvia easily passes this test.

Finally, there’s capital intensity.
The less capital a company needs to operate, the better.
Harvia’s CAPEX-to-Sales ratio stands at just 3.2%. This indicates Harvia is a capital-light business.
In general, Harvia’s numbers look very good.
4. Valuation
I always use 3 methods to look at the valuation of a company:
A comparison of the forward PE multiple with its historical average
Earnings Growth Model
Reverse Discounted-Cash Flow
A comparison of the multiple with the historical average
I first compare the current forward PE with its historical average over the past 10 years.
Today, Harvia trades at a forward PE of 28.0x compared to a historical average of 20.6x.
Based on this metric, the company looks expensive.

Earnings Growth Model
This model shows you the yearly return you can expect as an investor.
In theory, it’s easy to calculate your expected return:
Expected return = EPS Growth + Dividend Yield +/- Multiple Expansion (Contraction)
Here are the assumptions I use:
EPS Growth: 10.0% per year over the next 10 years
Dividend Yield: 1.6%
Forward PE to decline from 28.0x to 20.0x
Expected yearly return = 10.0% + 1.7% + 0.1((20.0x – 28.0x)/28.0x)) = 8.8%
Reverse DCF
Charlie Munger once said that if you want to find a solution to a complex problem, you should invert. Always invert. Turn the problem upside down.
A reverse DCF shows you the expectations implied in the current stock price.
You try to determine for yourself whether these expectations are realistic or not.
You can learn more about a reverse DCF here: Reverse DCF
The consensus states that Harvia’s Free Cash Flow over the next 12 months will be equal to €35.8 million.
Our Reverse DCF indicates that Harvia should grow its Free Cash Flow by 9.9% per year to return 10% per year to shareholders.
In the past 5 years, Harvia has grown its FCF at an average rate of 11.1%.
Going forward, analysts expect a long-term EPS growth of 18.0%.
In my opinion, this looks a bit too optimistic. That’s why I believe Harvia has little Margin of Safety at the current valuation levels.

Harvia:
Forward PE: 28.0x (lower than its 5-year average? < 20.6x? ❌)
Earnings Growth Model: 8.8% (Yearly return? > 10%? ❌)
FCF-Growth Reverse DCF: 9.9% (Realistic growth expectations? ❓)
5. Is Harvia Interesting Today?
Now let’s bring everything together.