

On Tuesday, September 29, I’m hosting a FREE masterclass where I’ll show you exactly how to find the best companies in the world.
It’s a live webinar for one hour. It’s 100% free and there’s a Q&A at the end where I’ll stay until all your questions have been answered.
You can register here.
In the entire world, there are more than 50,000 public companies.
This means you face two problems:
You can’t analyze them all
You only want to own the best of the best
Today we are using a stock screener (which you can use too) to find some of the best companies in the world.
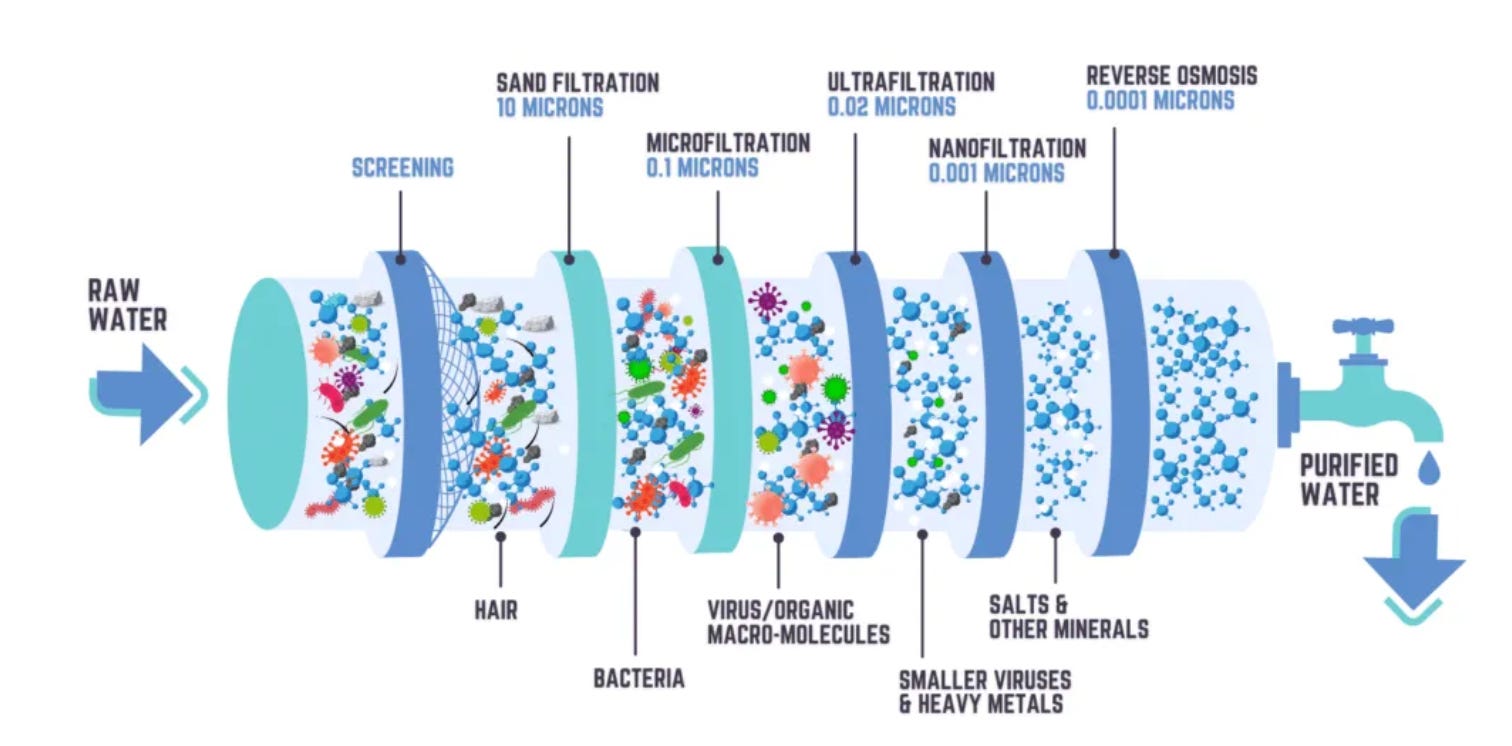
A stock screener?
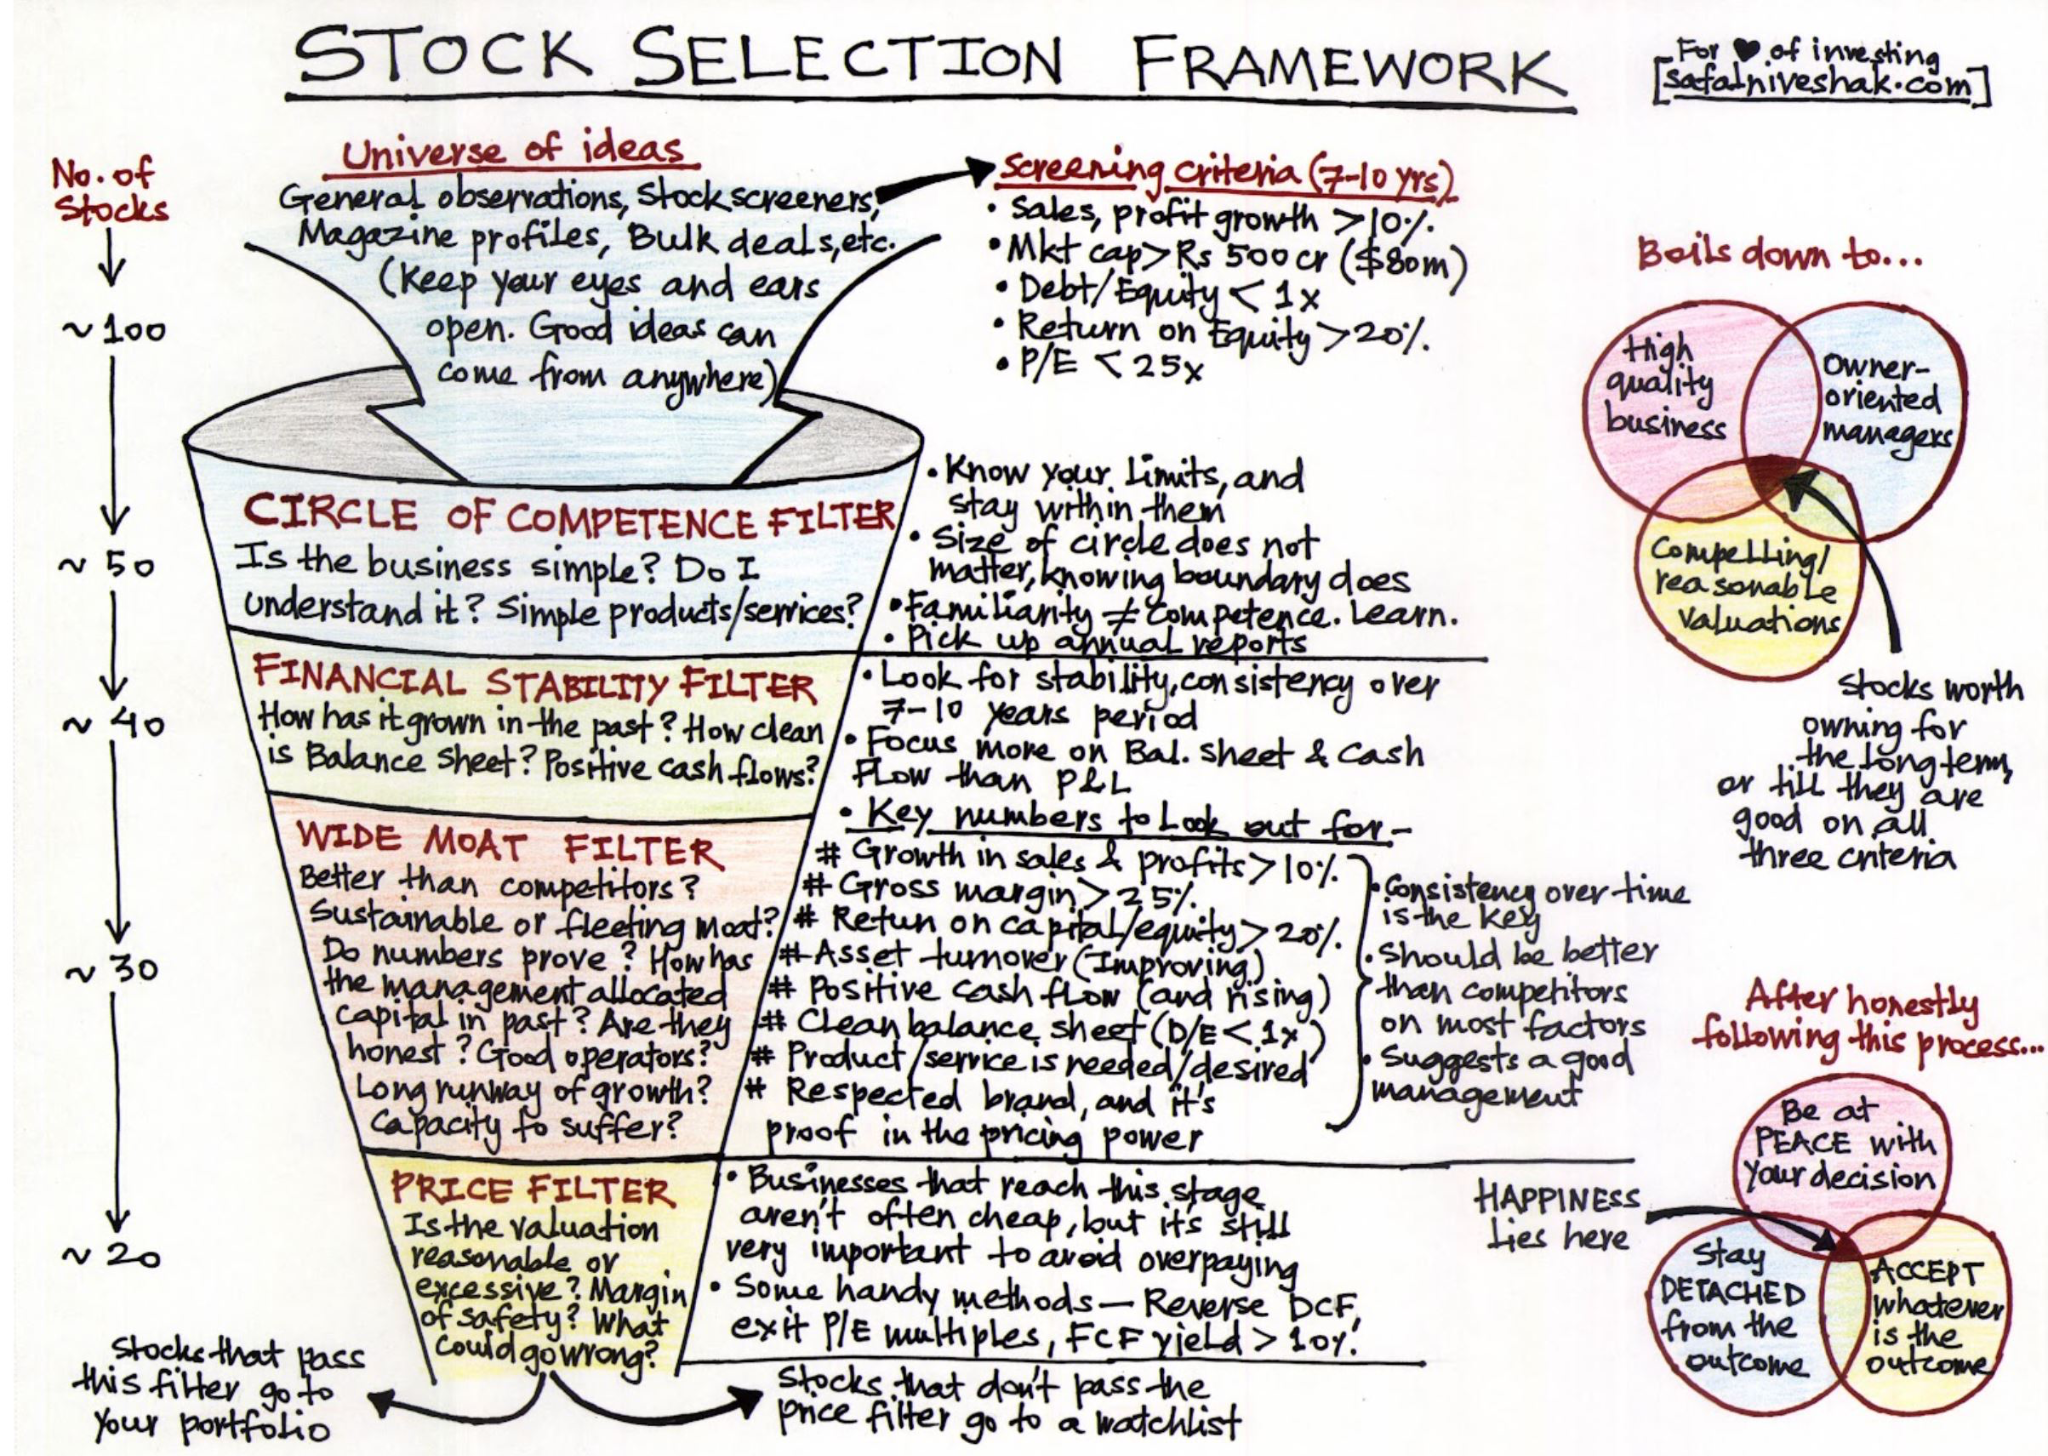
You can think of a stock screener as a set of filters.
You start with a big list of stocks.
Each criteria is a filter that removes part of the bad companies.
Every step makes the list of possible investments smaller.
Only a few companies will make it through every single filter.
Safal Niveshak beautifully visualized this:
Let’s build a stock screener together which helps you to find good companies.
For years I’ve written about the companies I own.
What I’ve never done is walk anyone through the process: the actual sequence I run every business through before a single dollar goes in.
On Tuesday, September 29 I’m doing exactly that, live, for one hour. Free, and there’s live Q&A at the end where I’ll stay until the questions run out.
Here’s what you’ll learn:
The six things I check before I buy
The order I check them in
The three kinds of business I keep coming back to
Why most professional fund managers don’t beat the index they’re paid to beat and what I do instead
The mistake that cost me 60% on my very first stock
You want to attend? It’s free:

Your Screening Criteria
Here are the criteria we will use:
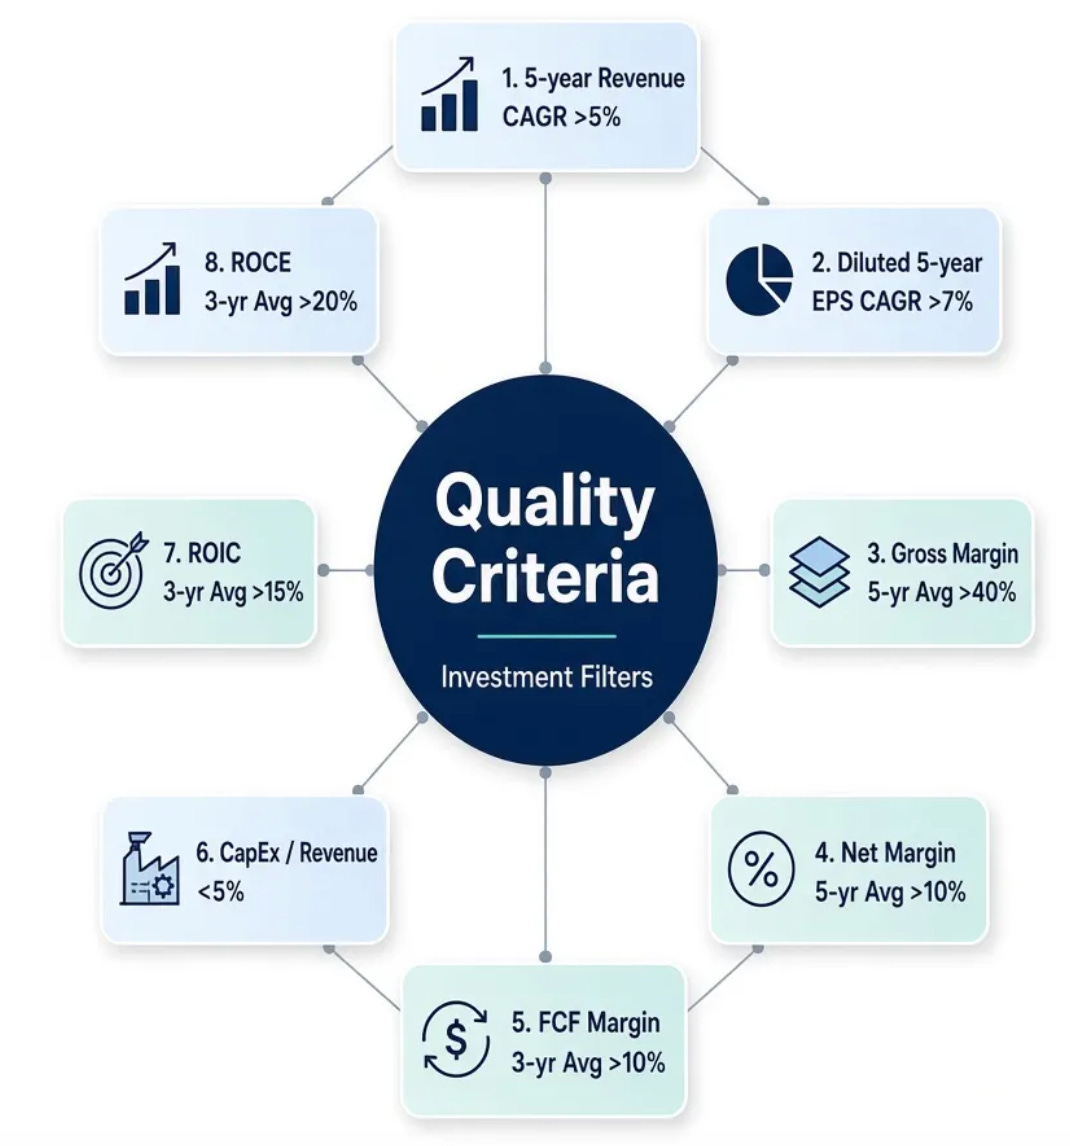
Let’s first help you understand why each of these metrics is important.
Revenue Growth (5-year Average > 5%)
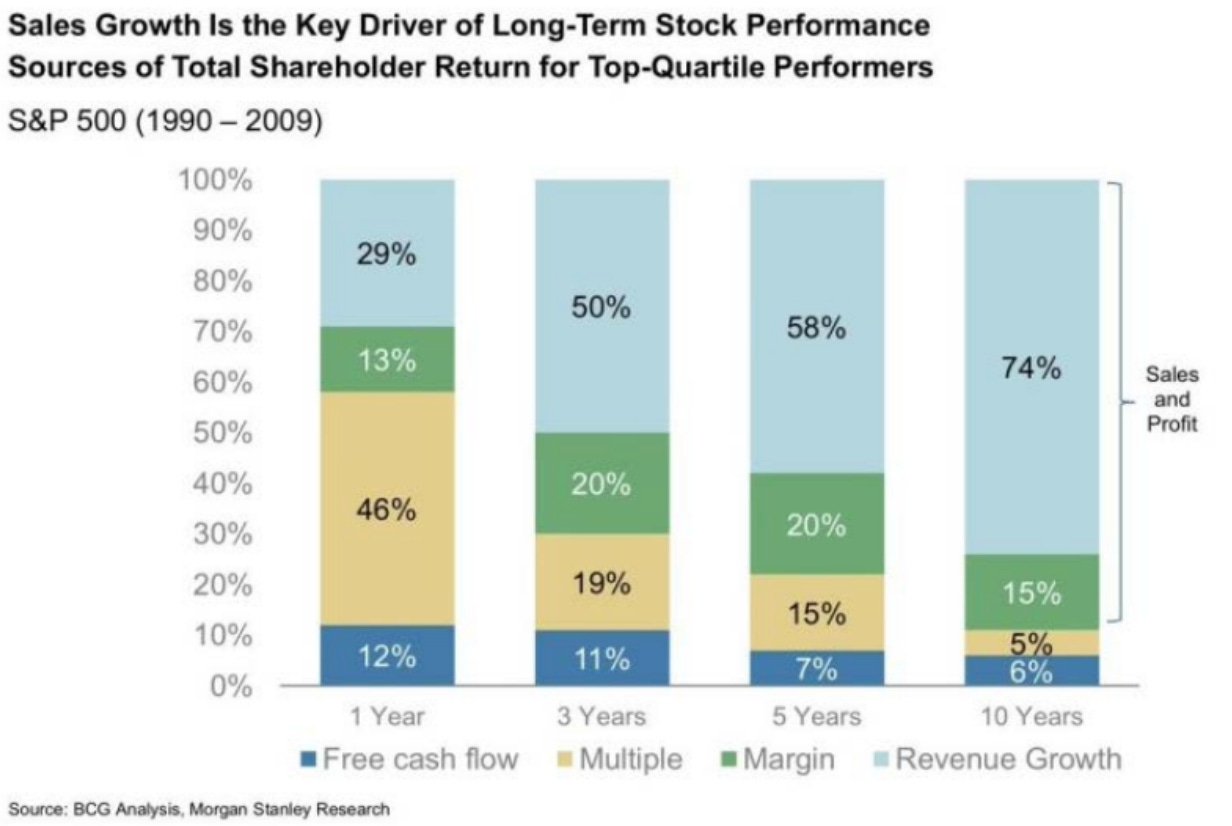
In the long term, revenue growth is the main driver for stock market returns.
Why?
Because without top-line growth, a company can’t grow its earnings or free cash flow at an attractive rate in the long term.
Diluted EPS Growth (5-year Average > 7%)
A company can grow its profits without making you richer.
How?
By issuing more shares.
That’s why we focus on diluted EPS. It measures earnings on a per-share basis and accounts for potential dilution from things like:
Stock-based compensation
Convertible bonds
Etc.
We want our share of the profits to grow, not just the company’s total profits.
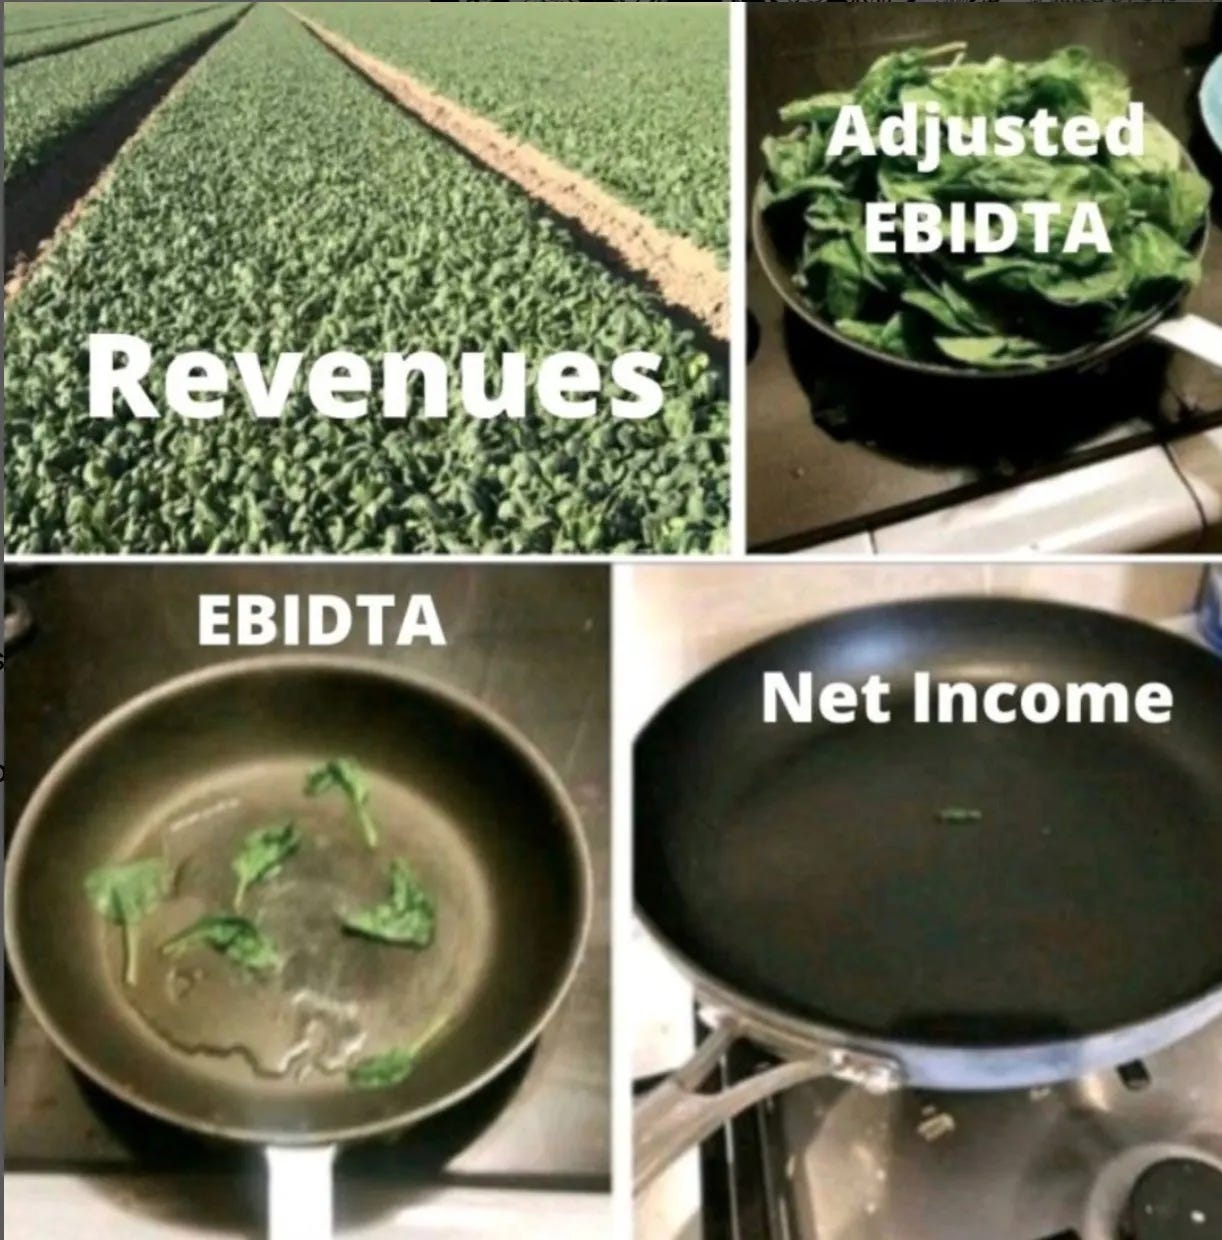
Gross Margin (5-year Average > 40%)
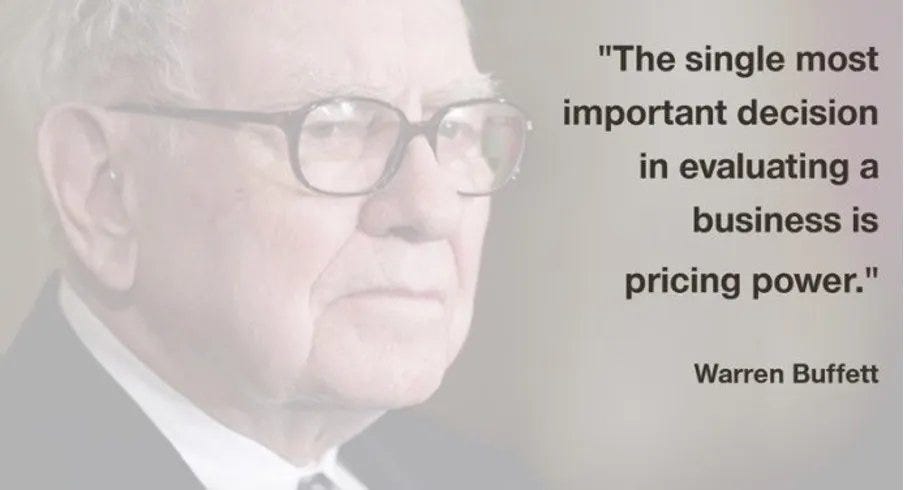
High gross margins are a good sign that the company has pricing power.
It means people are willing to pay much more than it costs to make the product.
Net Margin (5-year Average > 10%)
The higher the profitability, the better.
You want the Net Margin to be higher than 10%.
A higher net margin helps companies to do well during tough times.
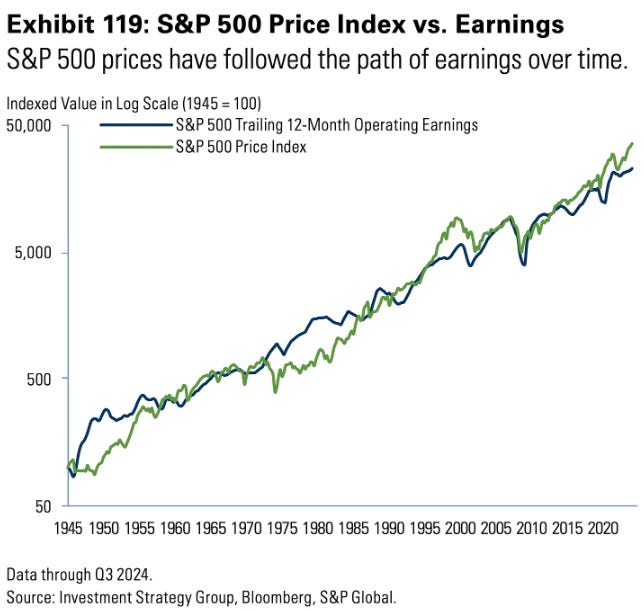
And in the long term, stock prices follow the evolution of earnings growth:
Free Cash Flow Margin (3-year Average > 10%)
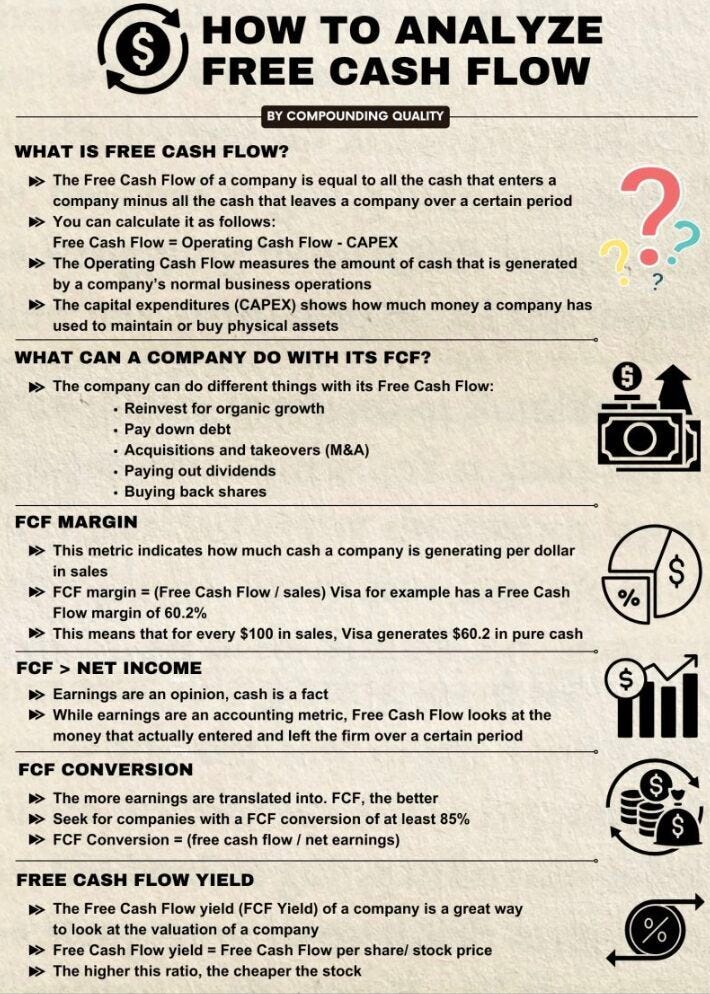
Earnings are an opinion. Cash flow is a fact.
The Free Cash Flow Margin shows how much of each dollar in sales is translated into pure cash.
We want this number to be higher than 10%.
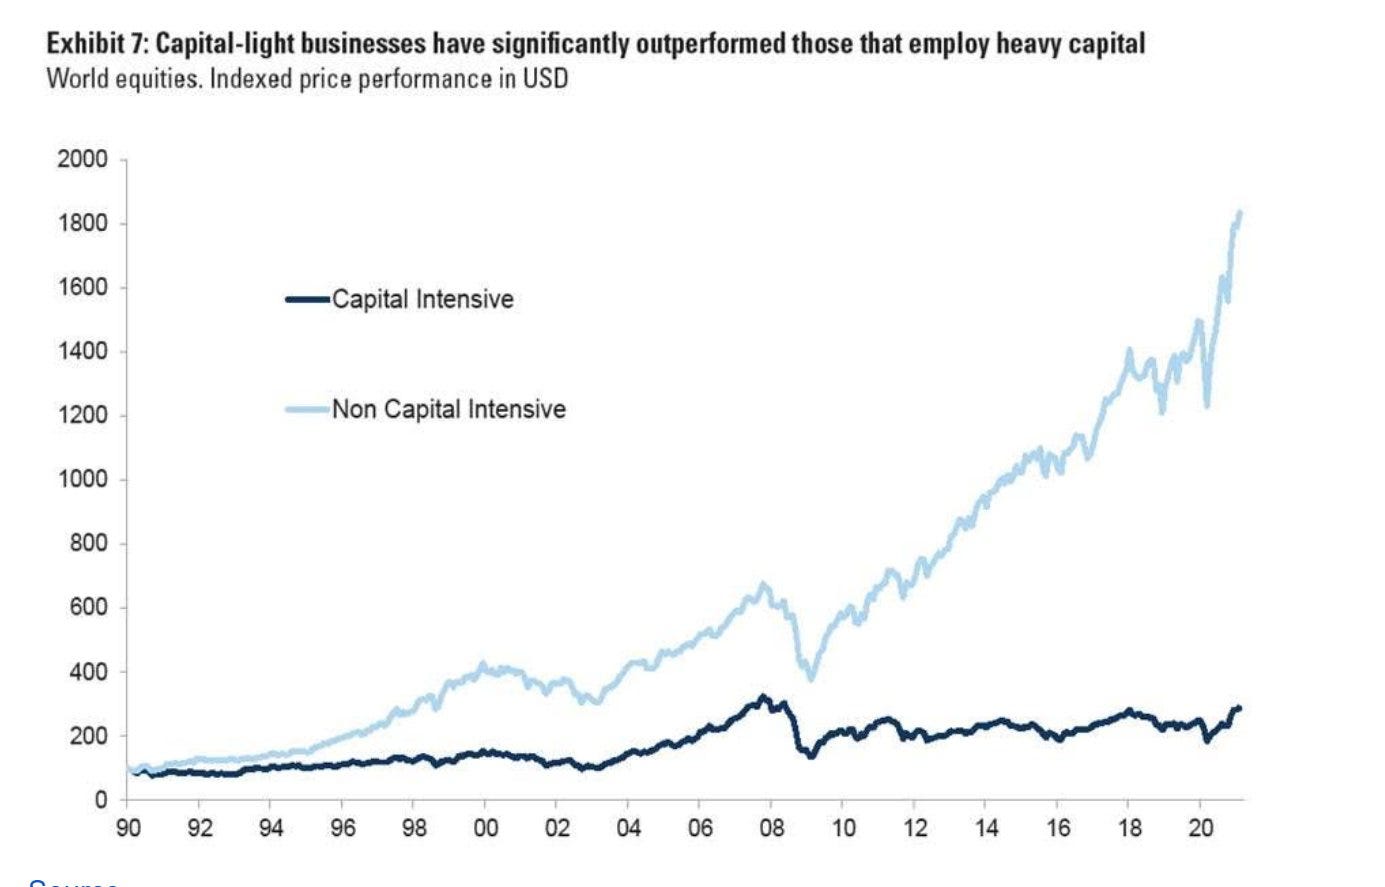
Low capital intensity (CAPEX / Revenue < 5%)
You want to buy companies that don’t need a lot of capital to run.
Why?
Heavy physical costs like factories or machinery can eat up all the profits.
That’s exactly why you want to own capital light businesses.
They tend to outperform in the long term:
Great capital allocation
Capital allocation is the most important task of management.
It’s the decision management makes about what to do with the money it earns.
In general, a company has 4 capital allocation options:
Organic growth
Strengthen the balance sheet
M&A
Return capital to shareholders (dividends and/or share buybacks)
If you want to learn more, you can read this article.
We use two criteria to screen for great capital allocators.
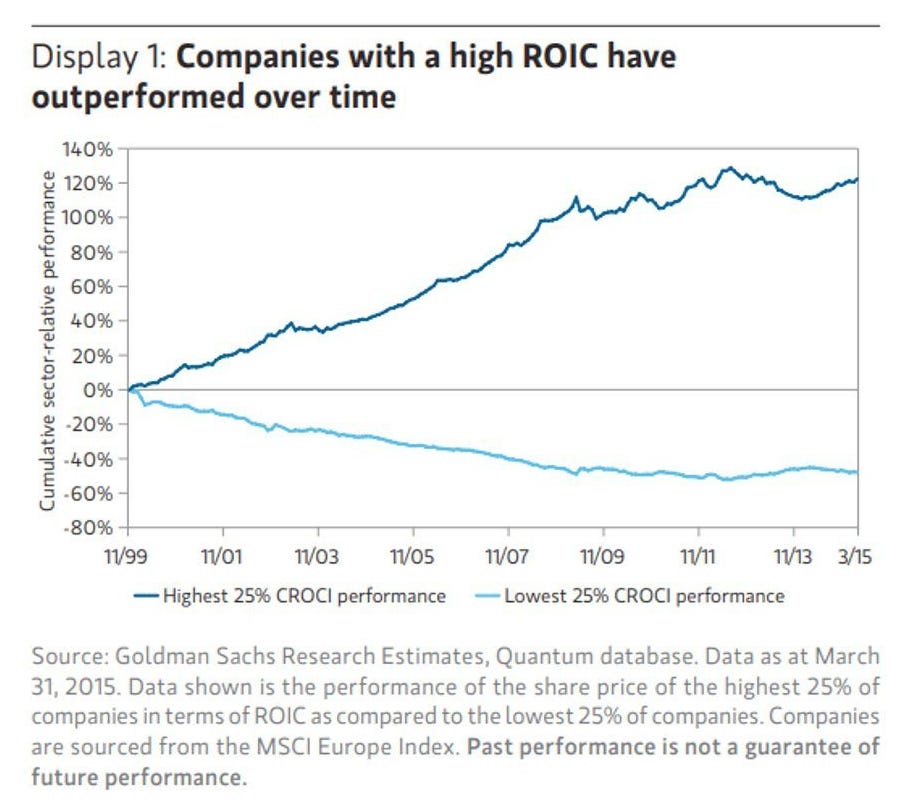
1. ROIC (3-year Average > 15%)
ROIC measures how efficiently a company translates the capital it has raised (equity + debt) into operating profit.
You want this number to be higher than 15%.
Why? Because the ROIC has to be higher than the WACC (cost of capital).
When this wouldn’t be the case, a company is destroying shareholder value by reinvesting in itself.
2. ROCE (3-year Average > 20%)
ROCE is a similar metric as ROIC.
You want this number to be higher than 20%.
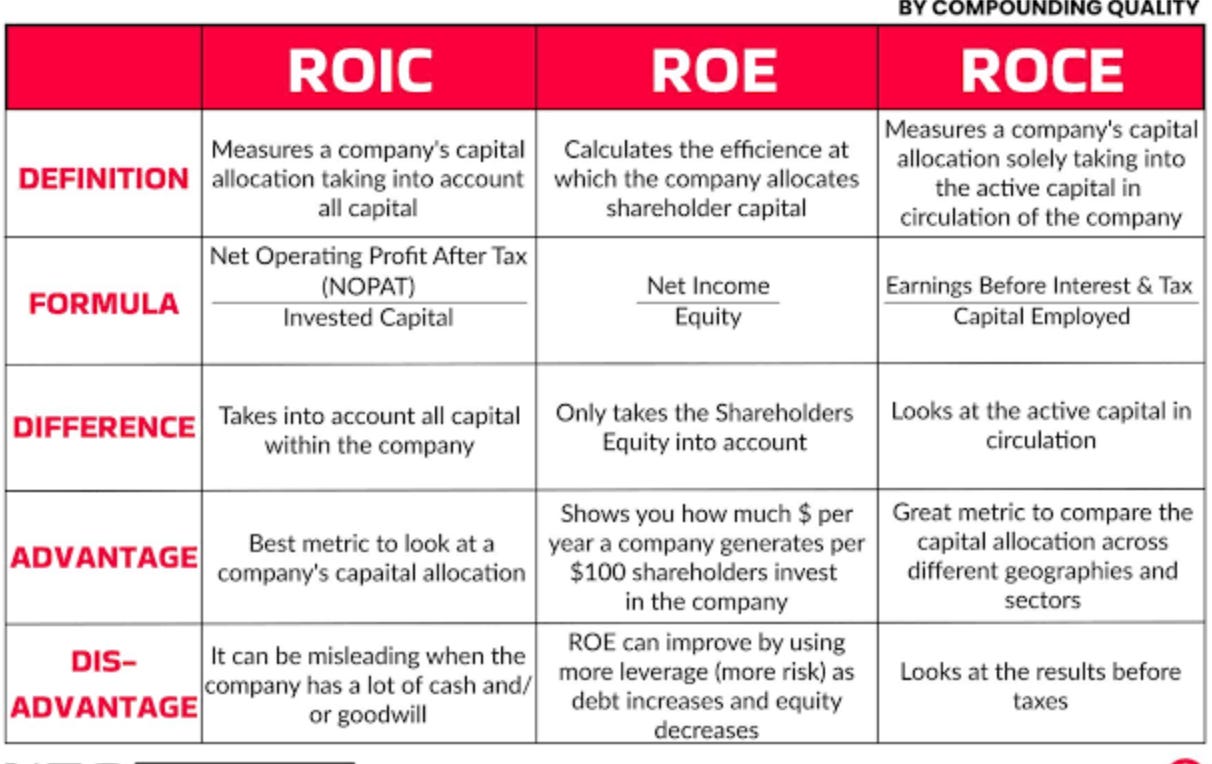
The difference between ROIC and ROCE (and ROE)?
You can find it here:
The results
Now let’s put all these criteria into a screener on Fiscal.ai.
A great thing about Fiscal?
You can exclude countries.
In our example, we excluded China.
We also excluded industries like banks.
China is way outside our circle of competence.
And the banks are a very specialized industry that use different metrics than the ones we’re looking at here.
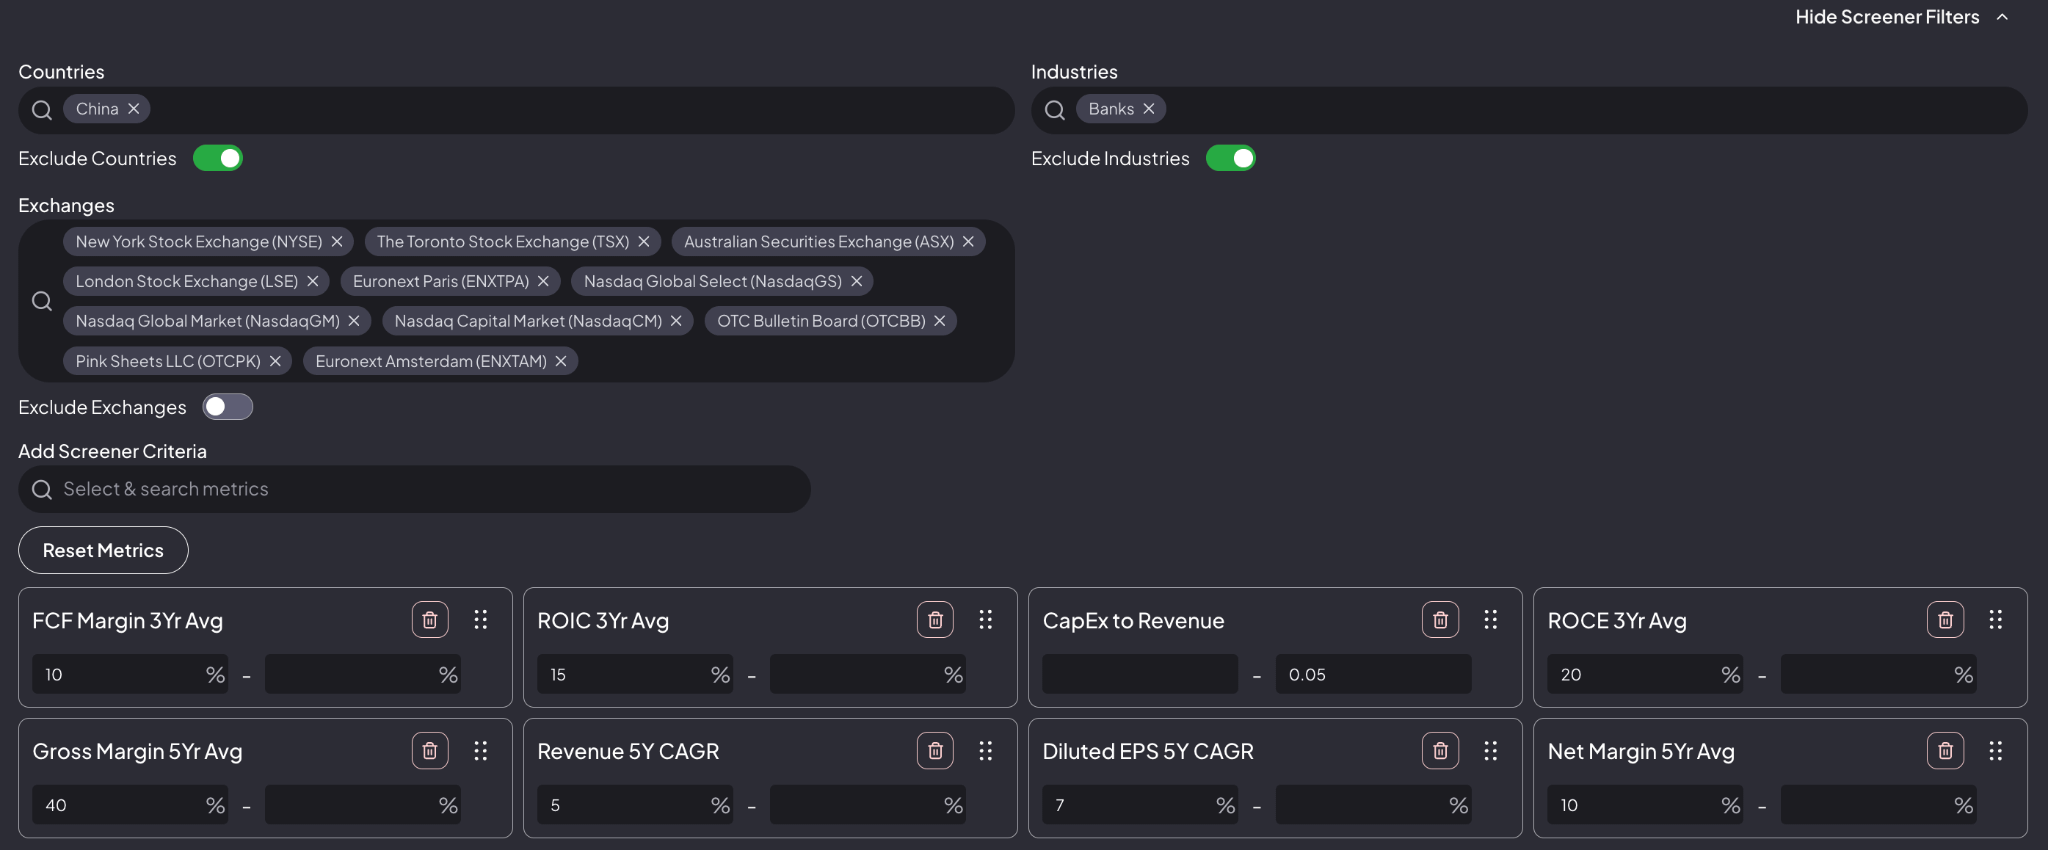
Out of 50,000+ companies, this screen found fewer than 100 worth a closer look.
Revenue Growth
Here are some companies that have high revenue growth and match all criteria:
Nvidia: +69.1%
DLocal: +52.4%
Arista Networks: +32.0%

EPS Growth
Here are some companies that matched all criteria with that have high EPS growth:
AppLovin: +98.3%
PDD Holdings: +95.1%
Exelixis: +61.2%

High ROIC
Here are some companies from the screener with a high ROIC:
Rightmove: 363.5%
Games Workshop: 84.9%
Deckers Outdoors: 76%

Download the Screener Results
Want to see all the companies that passed our criteria?
You can find them here:
