

Warren Buffett just bought Google (Alphabet).
It’s a company with one of the widest moats ever.
Let’s teach you everything you need to know today.

Google (Alphabet Inc.) - General Information
👔 Company name: Google (Alphabet Inc.)
✍️ ISIN: US02079K3059
🔎 Ticker: GOOGL
📚 Type: Monopoly
📈 Stock Price: $293.0
💵 Market cap: $3.5 trillion
📊 Average daily volume: $3.2 billion
Onepager
Here’s a onepager with the essentials of Google.
You can click on the picture to expand:

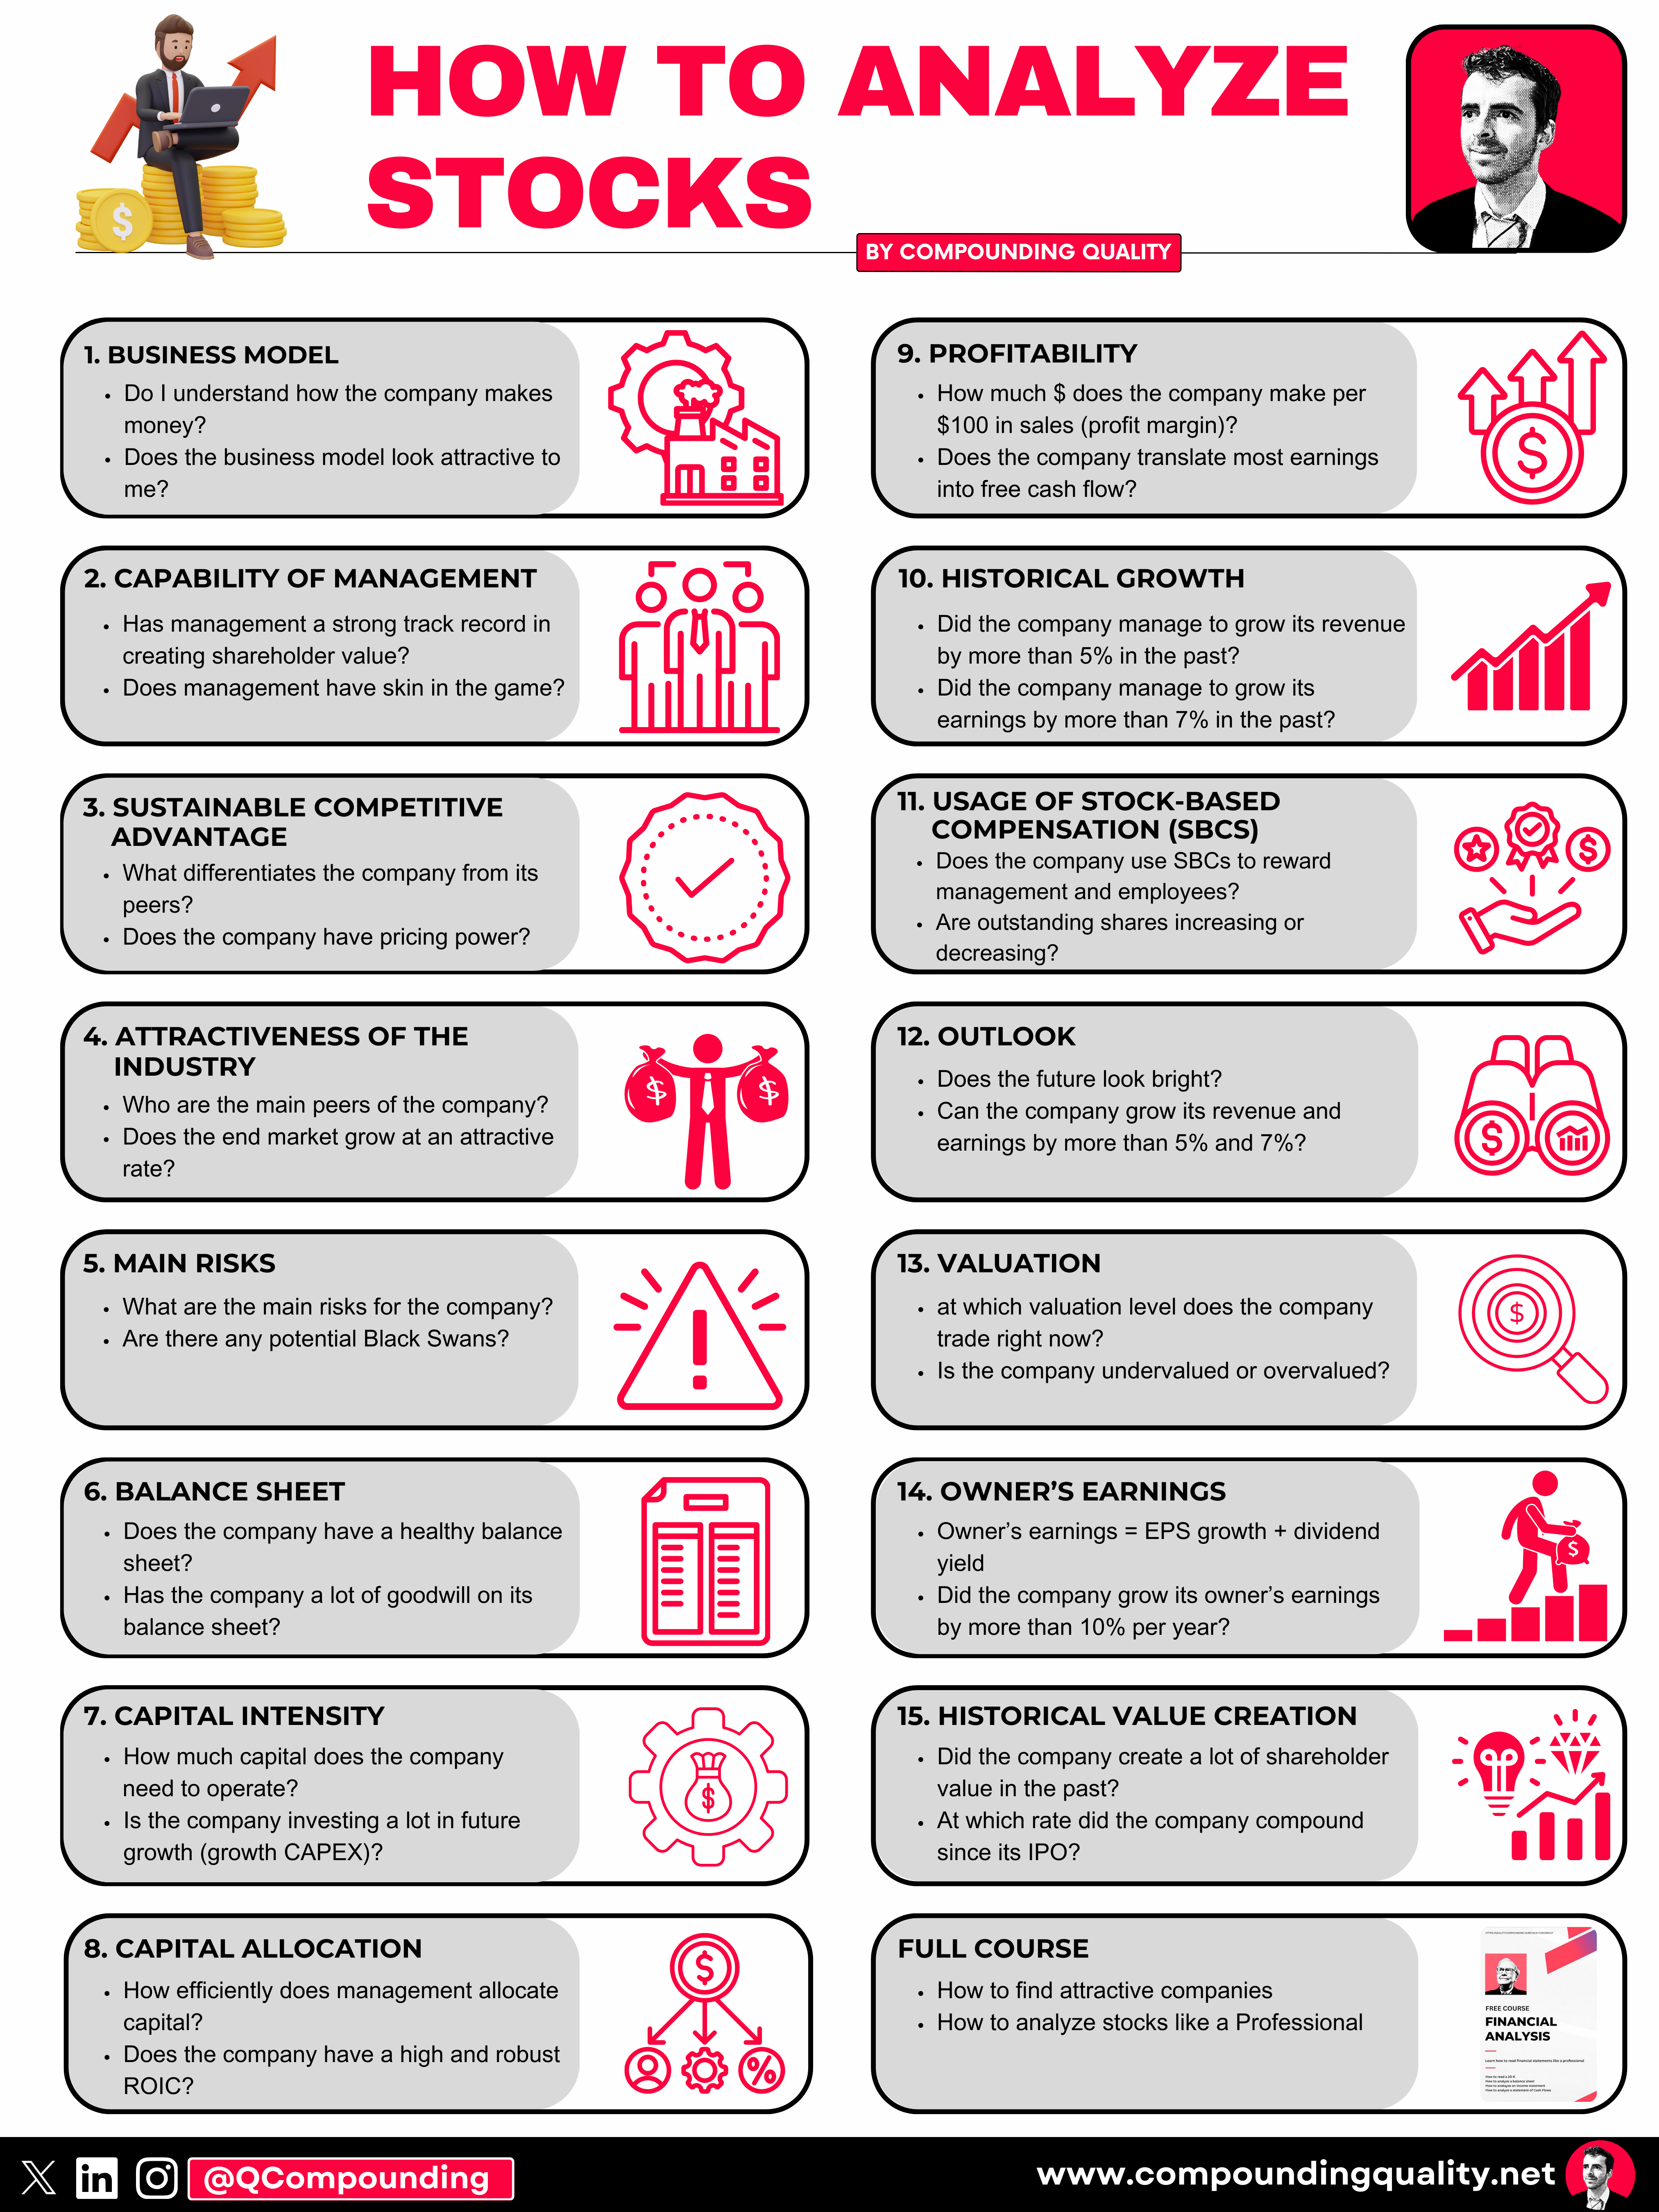
15-Step Approach
Now let’s use our 15-step approach to analyze the company.
At the end of this article, we’ll give Google a score on each of these 15 metrics, resulting in a Total Quality Score.
1. Do I understand the business model?
While you’re reading this sentence, approximately 350,000 Google searches are generated.
But did you know that Google once had a different name?
Back in 1998, two Stanford students, Larry Page and Sergey Brin, built a little search engine called BackRub.
It looked at “backlinks” to rank web pages. Not super catchy.
Then something funny happened.
They wanted to name their project after the number googol (a 1 followed by 100 zeros).
But when someone accidentally wrote Google on a check, the name stuck.
The rest is history.
Their goal was to create a search engine that could organize the vast amount of information available on the internet and make it easily accessible to everyone.
They succeeded. Today, Google has a market share of 90% in the search engine market.
Why is it so popular? Google’s products are high-quality and free.
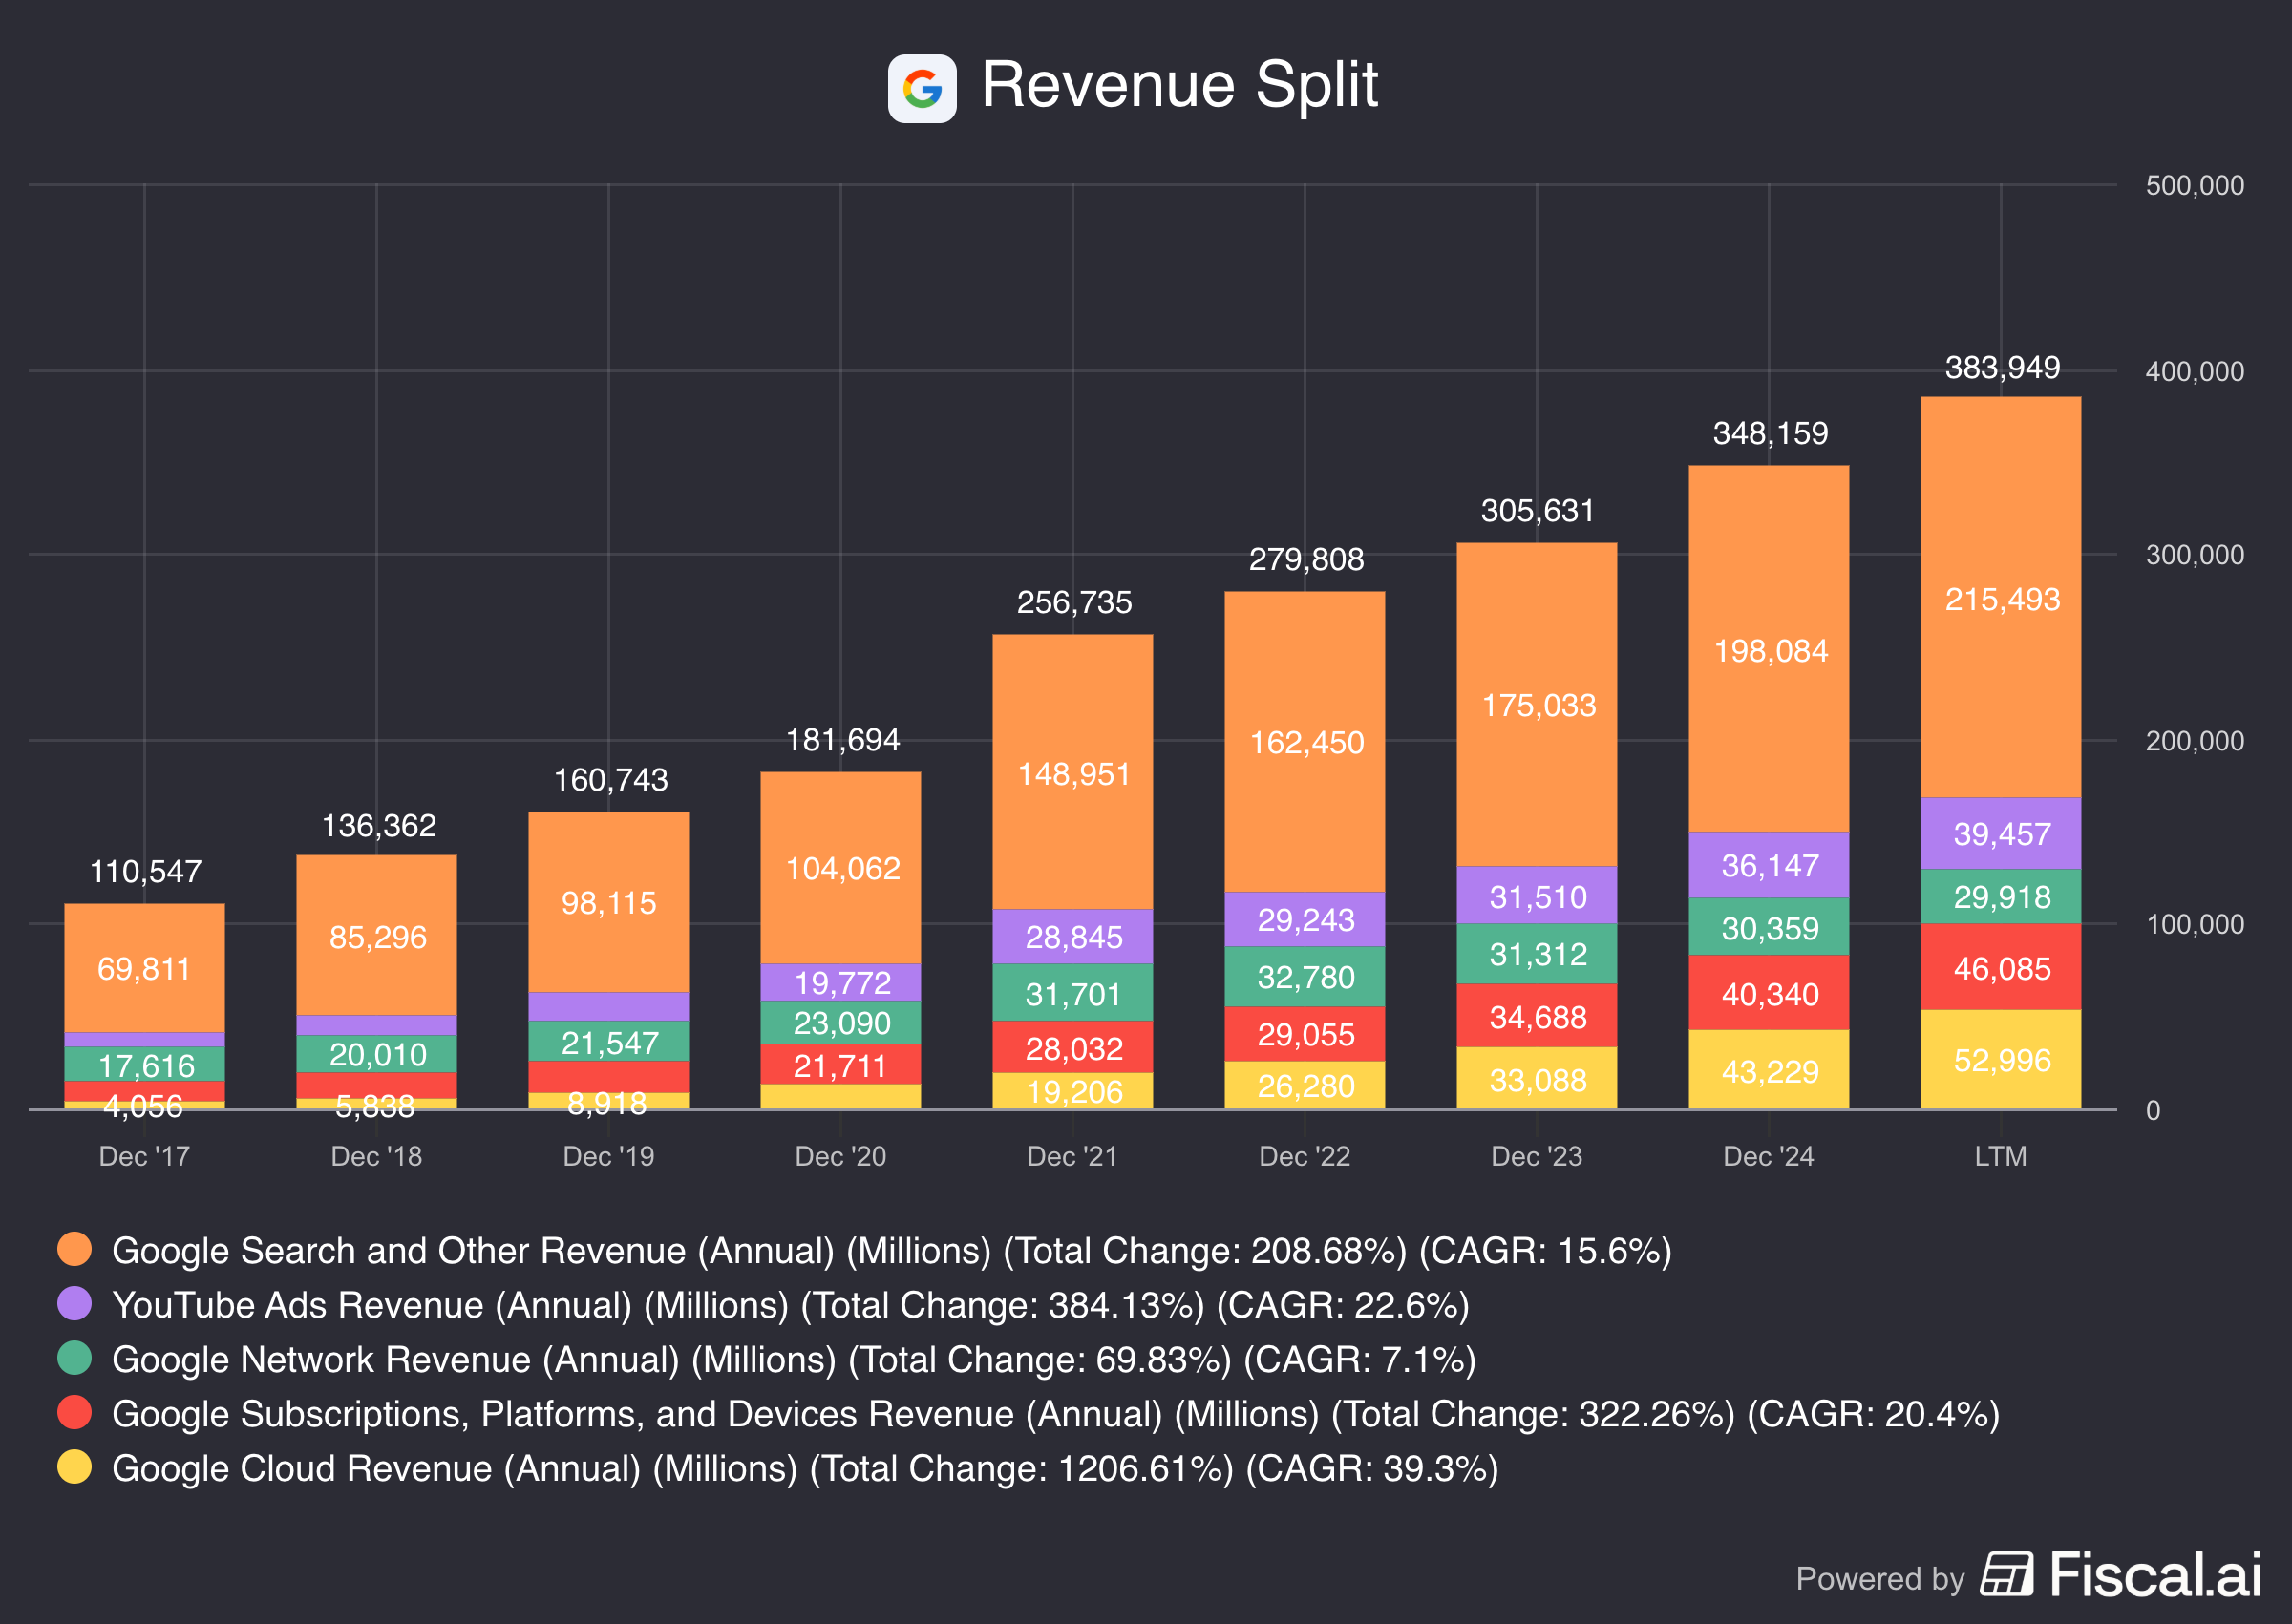
Google makes money in lots of ways:
Google Search (55.9% of total revenue): Companies pay Google when you click on ads after searching
Google Cloud (13.7% of total revenue): Companies use Google’s cloud to store data
Subscriptions, Platforms, and Devices (12.0% of total revenue): People pay for tools like Gmail, Google Workspace, or buy a Pixel phone
YouTube Ads (10.2% of total revenue): On YouTube, Google earns money when you watch or click an ad
Google Networks (7.7% of total revenue): Google shows ads on other websites too, and earns money from those clicks
Other (0.5% of total revenue): Google also makes money from books, movies, and licensing its technology
2. Is management capable?
Google is a special place to work, to say the least. At some point, they rented goats to mow the lawn. Yes. Goats.
It was a more eco-friendly approach.
But here’s the part I love: Employees at Google are allowed to spend 20% of their time on personal projects. The only rule? The project should be useful for the company.
Some of Google’s most iconic innovations, like Gmail, came from these projects.
Google might be a big company. But deep down, it still runs like a founder-led startup.
Sundar Pichai has been the CEO of Google since 2015. He joined the company in 2004 and played a key role in making Google Chrome, Android, and Google Drive.
It’s great to see that the co-founders Larry Page and Sergey Brin are still active board members. Together, they own over 51% of voting rights.
In total, insiders own 6.3% of Alphabet (value: $216 billion). Most of the ownership is held by Page and Brin.

Another interesting shareholder? Warren Buffett.
Buffett once joked in 2017 that he should have bought Google years ago.
Especially since Geico, one of Berkshire’s companies, was spending huge amounts on Google ads.
Charlie Munger said multiple times that they screwed up too:
“I feel like a horse’s ass for not identifying Google earlier … We screwed up."

“I think that’s a good idea not to play where the other people are better … But … if you ask me in retrospect, what was our worst mistake in the tech field … I think we were smart enough to figure out Google. … I would say that we failed you there, and we were smart enough to do it and didn’t do it.”
Recently, Berkshire Hathaway bought 18 million shares of Google.
Today, that stake is worth $4.3 billion.
3. Does the company have a sustainable competitive advantage?
Google (Alphabet) has one of the widest moats ever.
“Google has a huge new moat. In fact, I’ve probably never seen such a wide moat.” - Charlie Munger, 2009You might be wondering, why can’t competitors copy what Google does?
Google has been collecting data and improving its algorithms for over 25 years. No one can catch up with that.
That’s why Google owns 90% of the search engine market.
To state the obvious, Google has a monopoly.
Even more, Google’s monopoly is so obvious that the term “Google” has become a verb in the English dictionary.
When was the last time you said you would ‘google’ something?
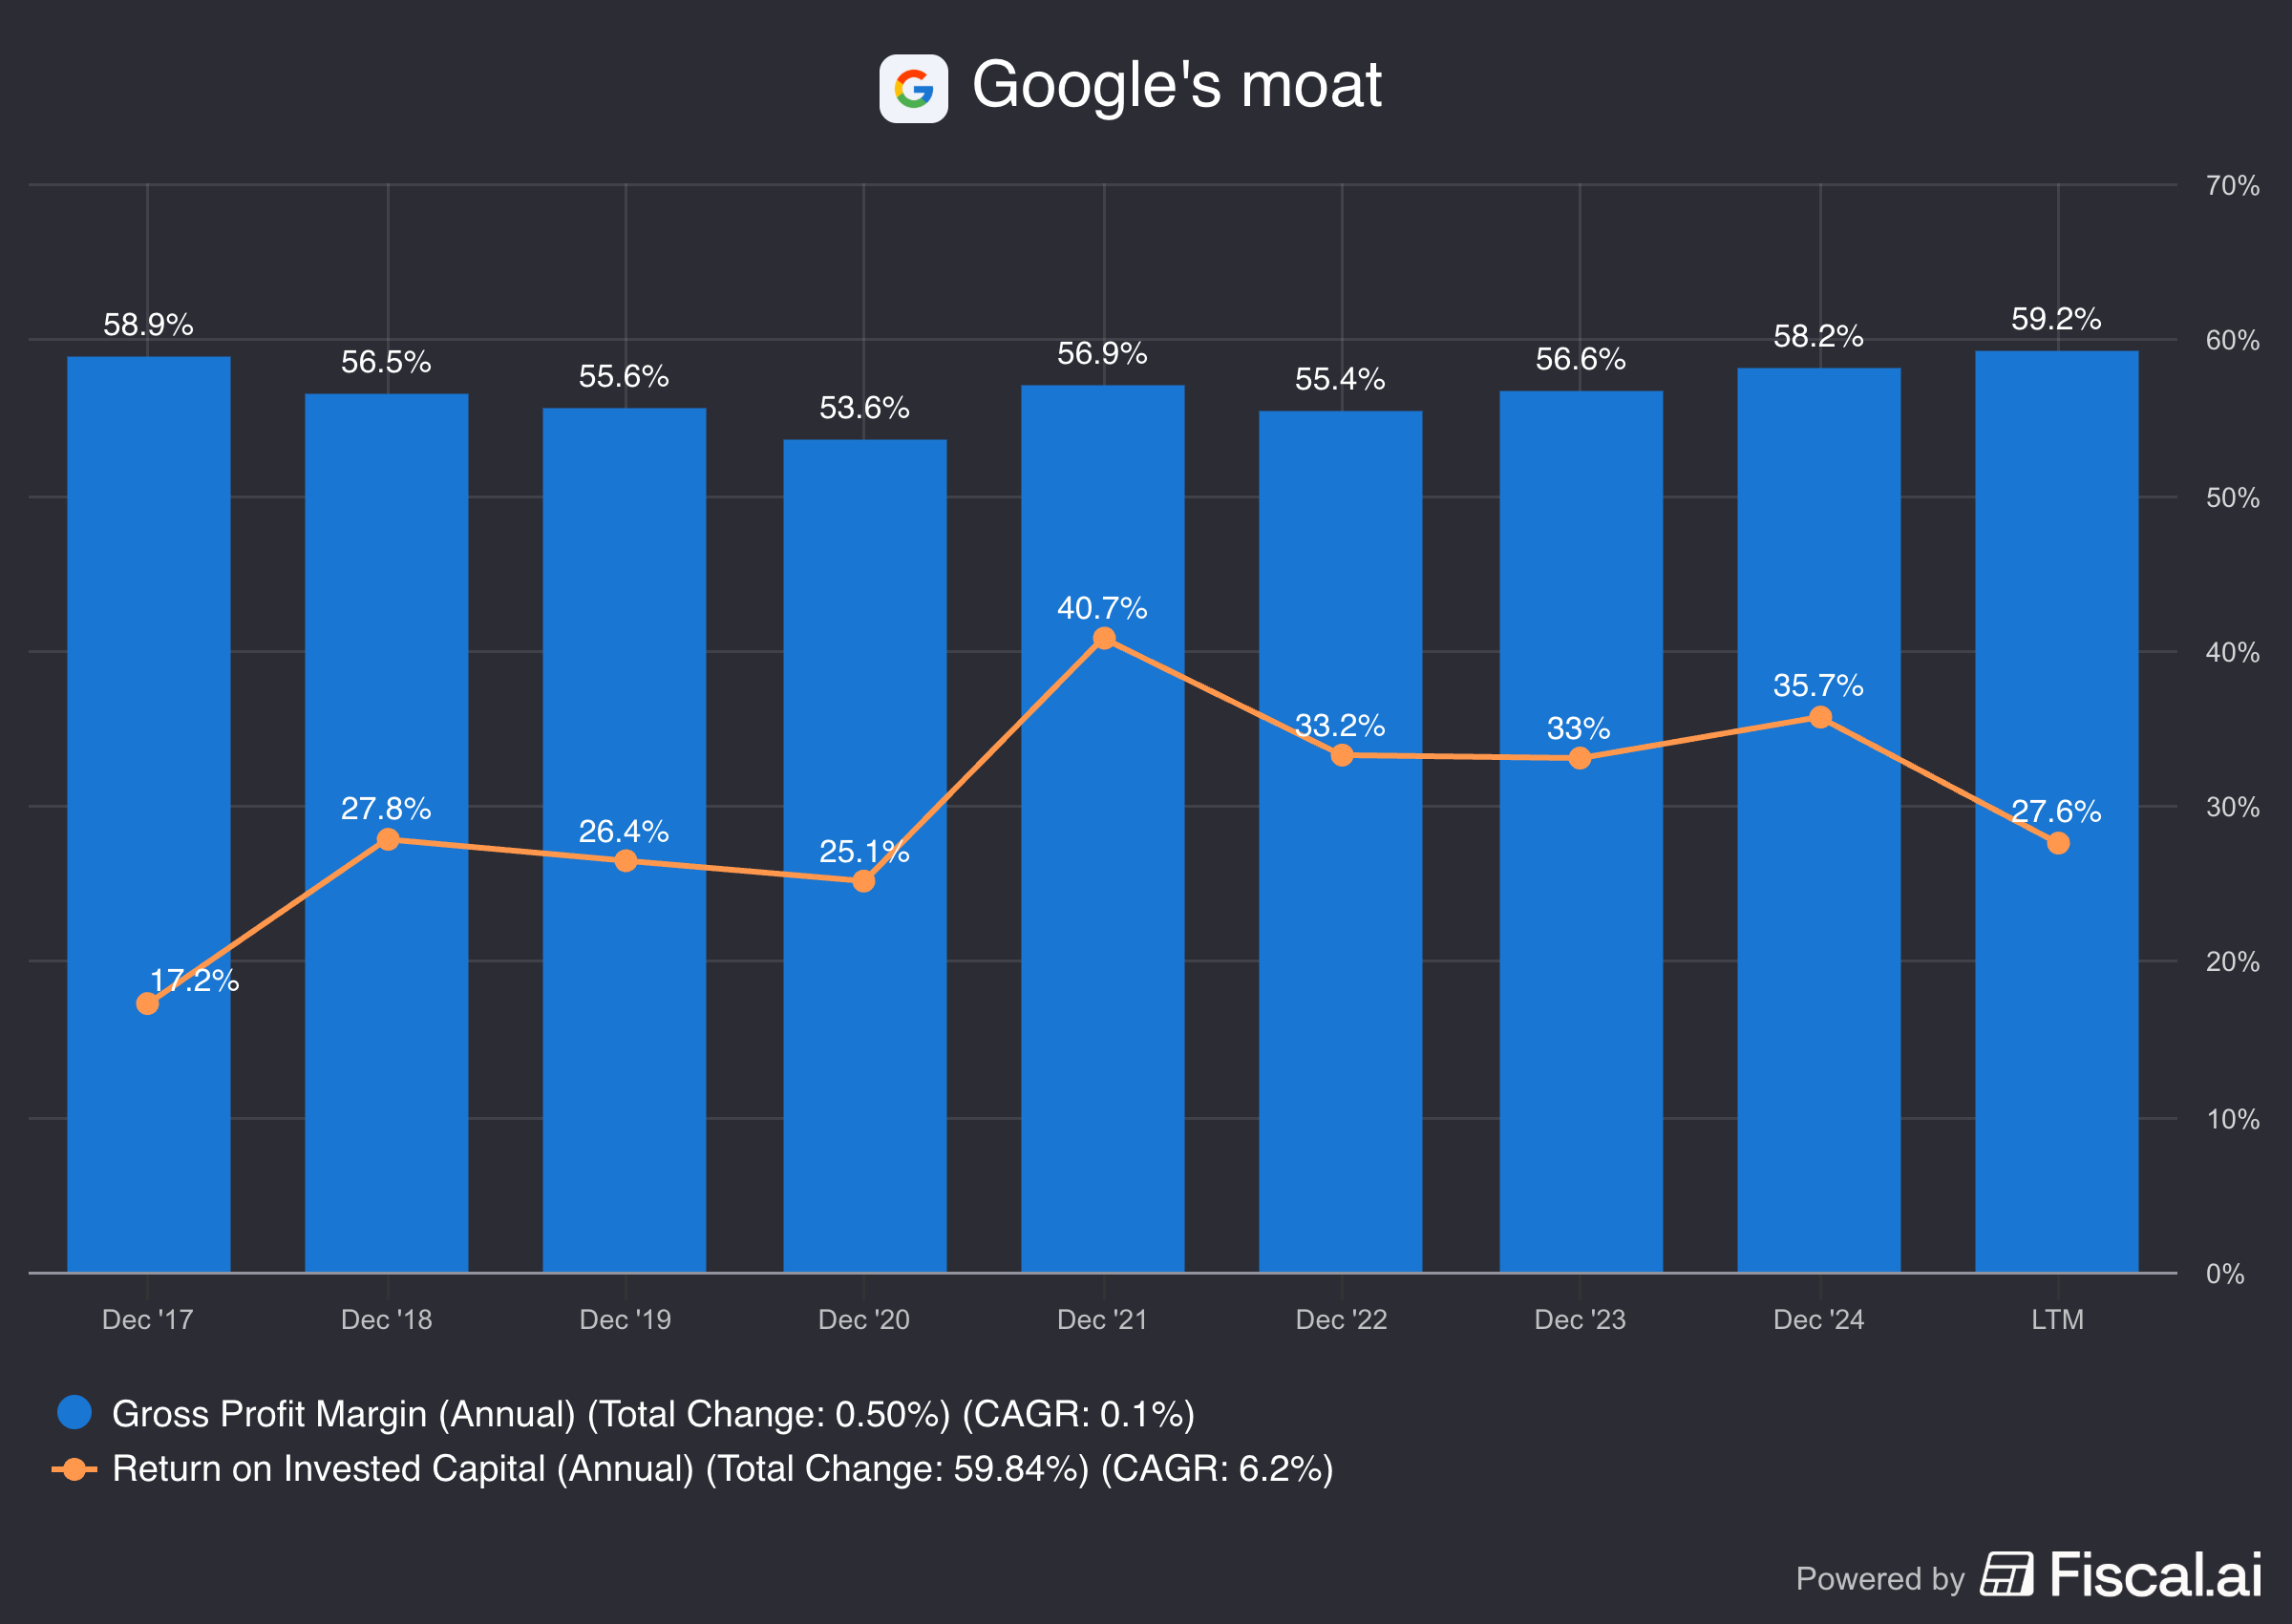
Companies with a sustainable competitive advantage are often characterized by a high and robust Gross Margin and ROIC:
Gross Margin: 59.2% (Gross Margin > 40%? ✅)
ROIC: 27.6% (ROIC > 15%? ✅)
4. Is the company active in an attractive end market?
Google’s search engine market faces its biggest threat yet: People are no longer typing every question into Google.
Instead, they’re using AI chatbots like ChatGPT. Why? Because they give an answer and not just a few links.
The majority of Google’s revenue still depends on search ads.
If fewer people search… ad money disappears.
Google knows this. That’s why they’re adding AI to their own search tool.
But it’s not all about search.
They also make money with:
YouTube (ads + premium subscriptions)
Android (licenses + Play Store fees)
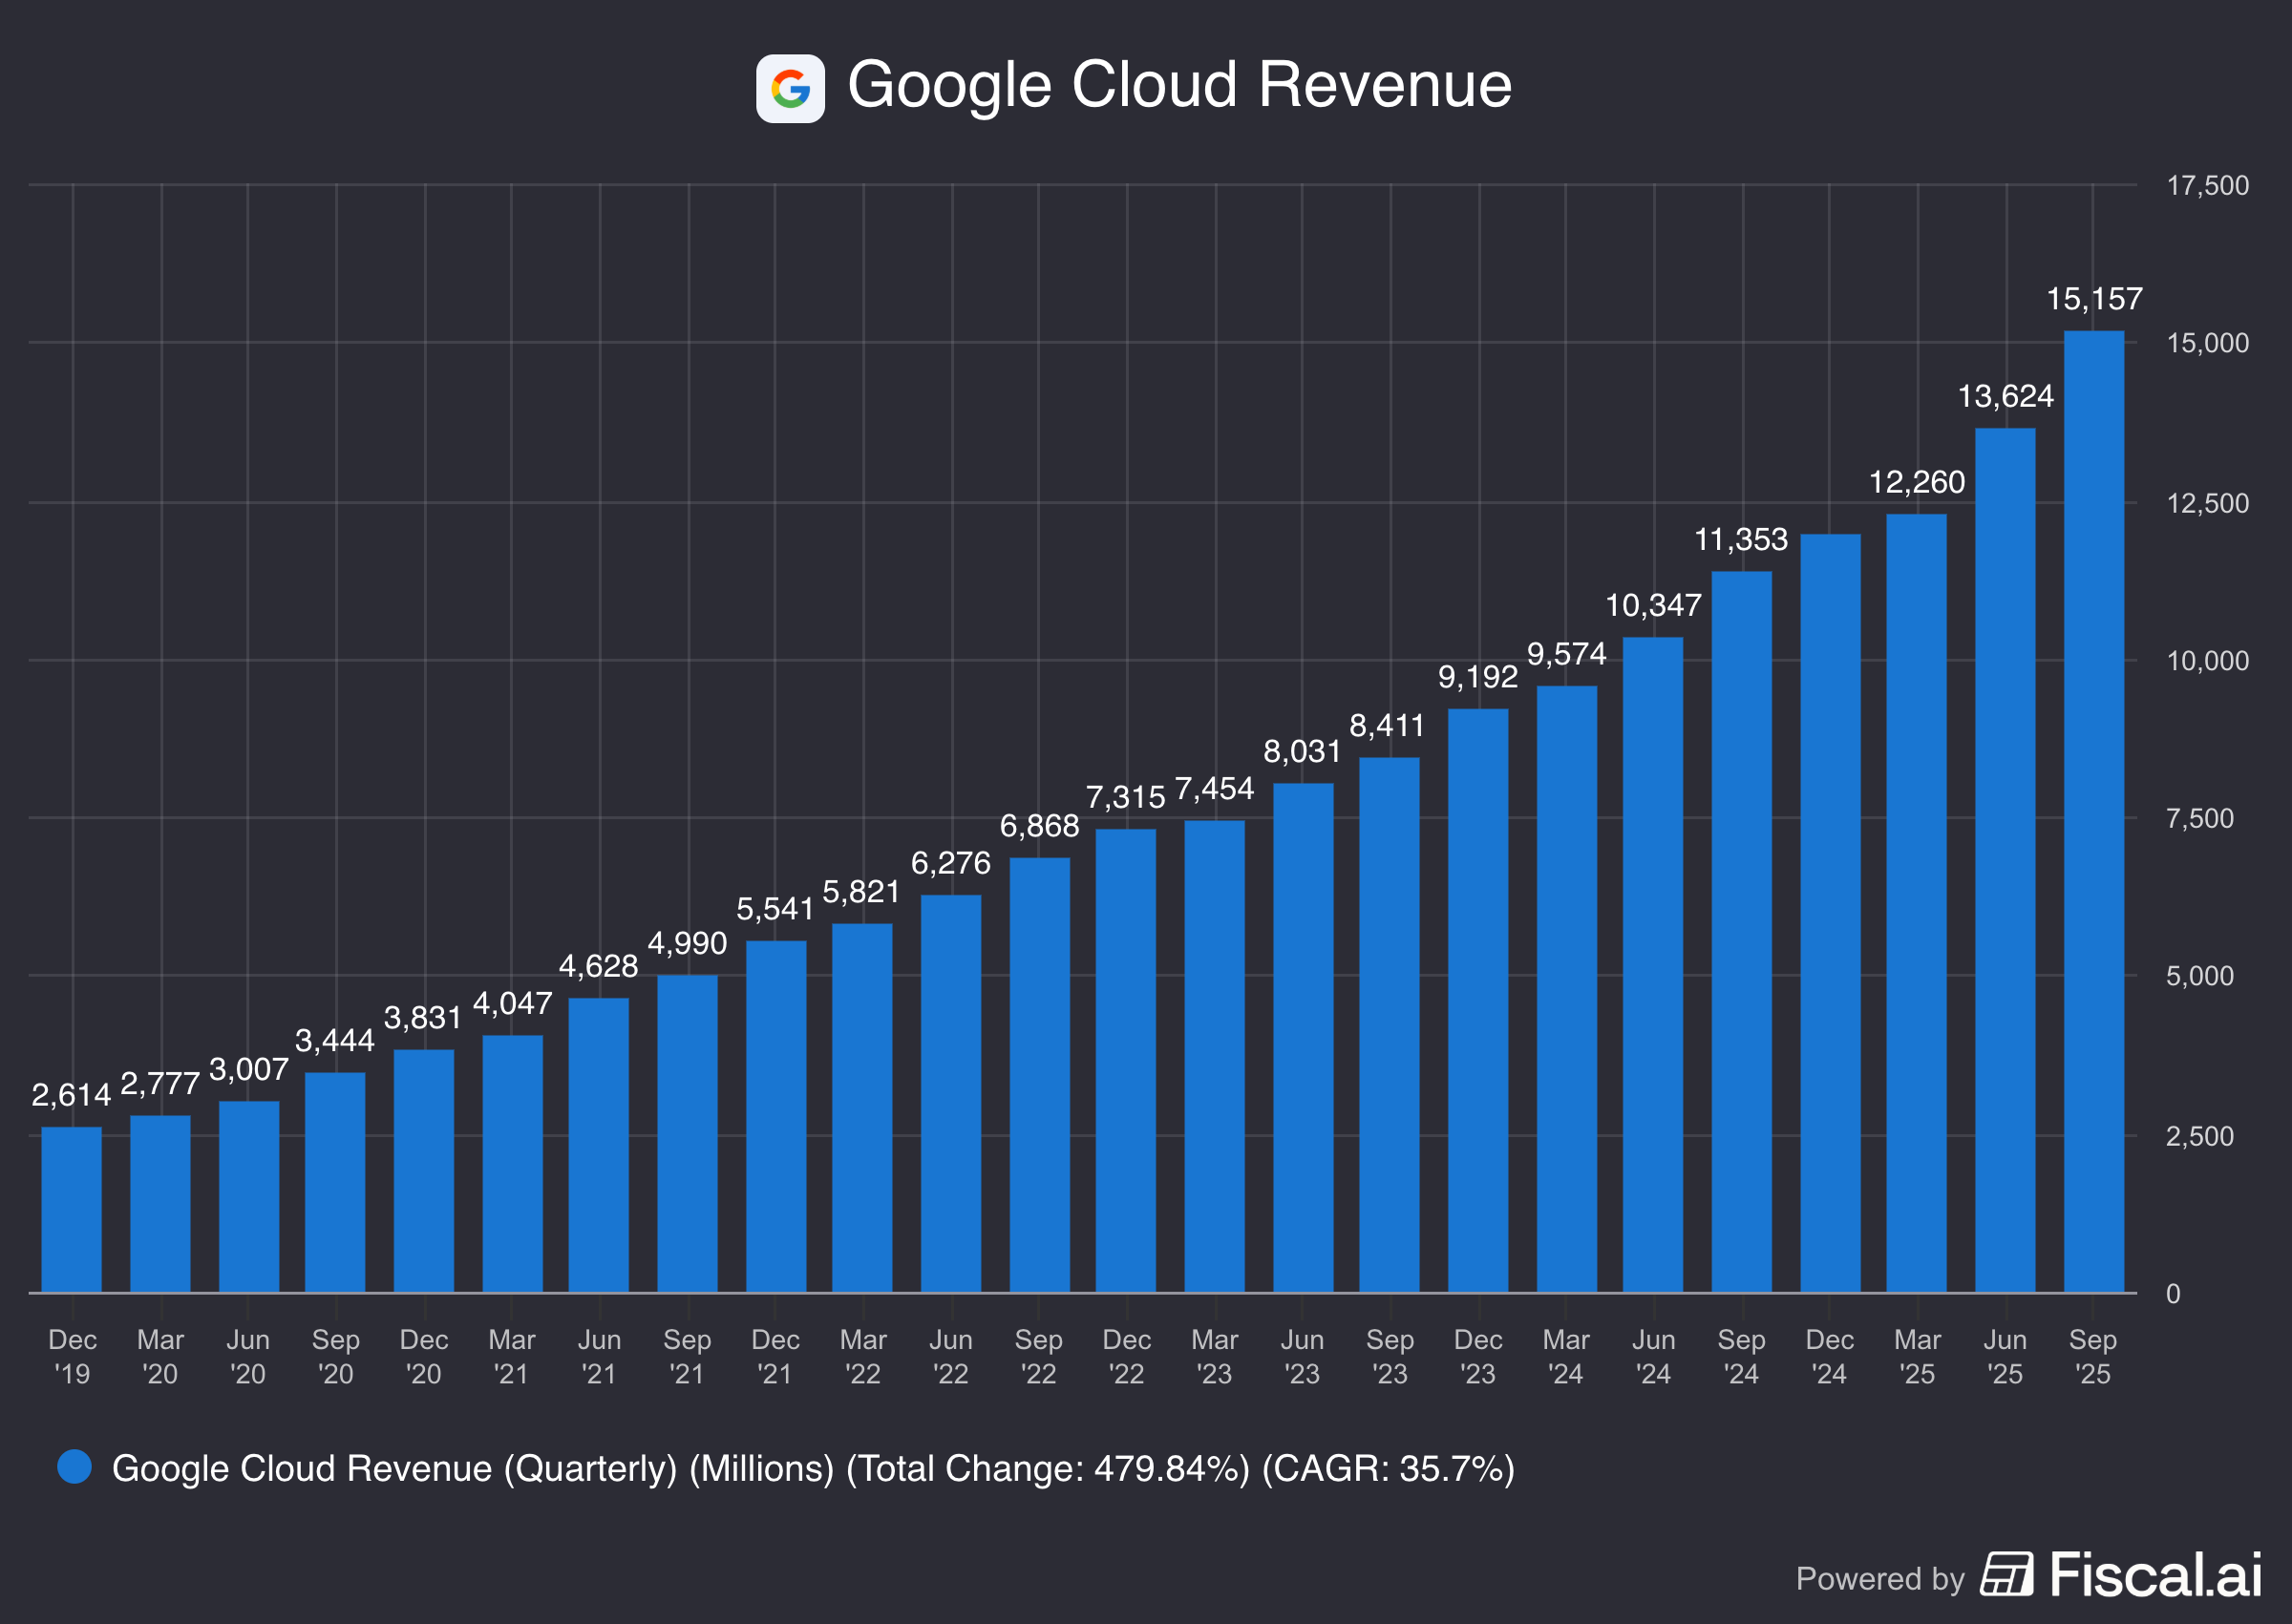
Google Cloud (data, AI & enterprise software)
Hardware (Pixel phones, Nest, Fitbit)
The cloud segment is the real growth driver right now:
5. What are the main risks for the company?
Here are some of the main risks for Google:
Competition from AI chatbots: More and more people are asking their questions directly to AI assistants like ChatGPT
Platform dependency: Apple could remove Google as the default search engine on iPhone
Regulatory pressure: Governments worldwide are launching antitrust lawsuits that could break up or heavily restrict Google’s business
Weaker innovation: Despite huge resources, Google has struggled to launch successful new products beyond search and YouTube
Ad market shifts: Advertisers are moving budgets to other platforms like TikTok and Amazon, where targeting is often better and cheaper
Rich valuation level (see later)
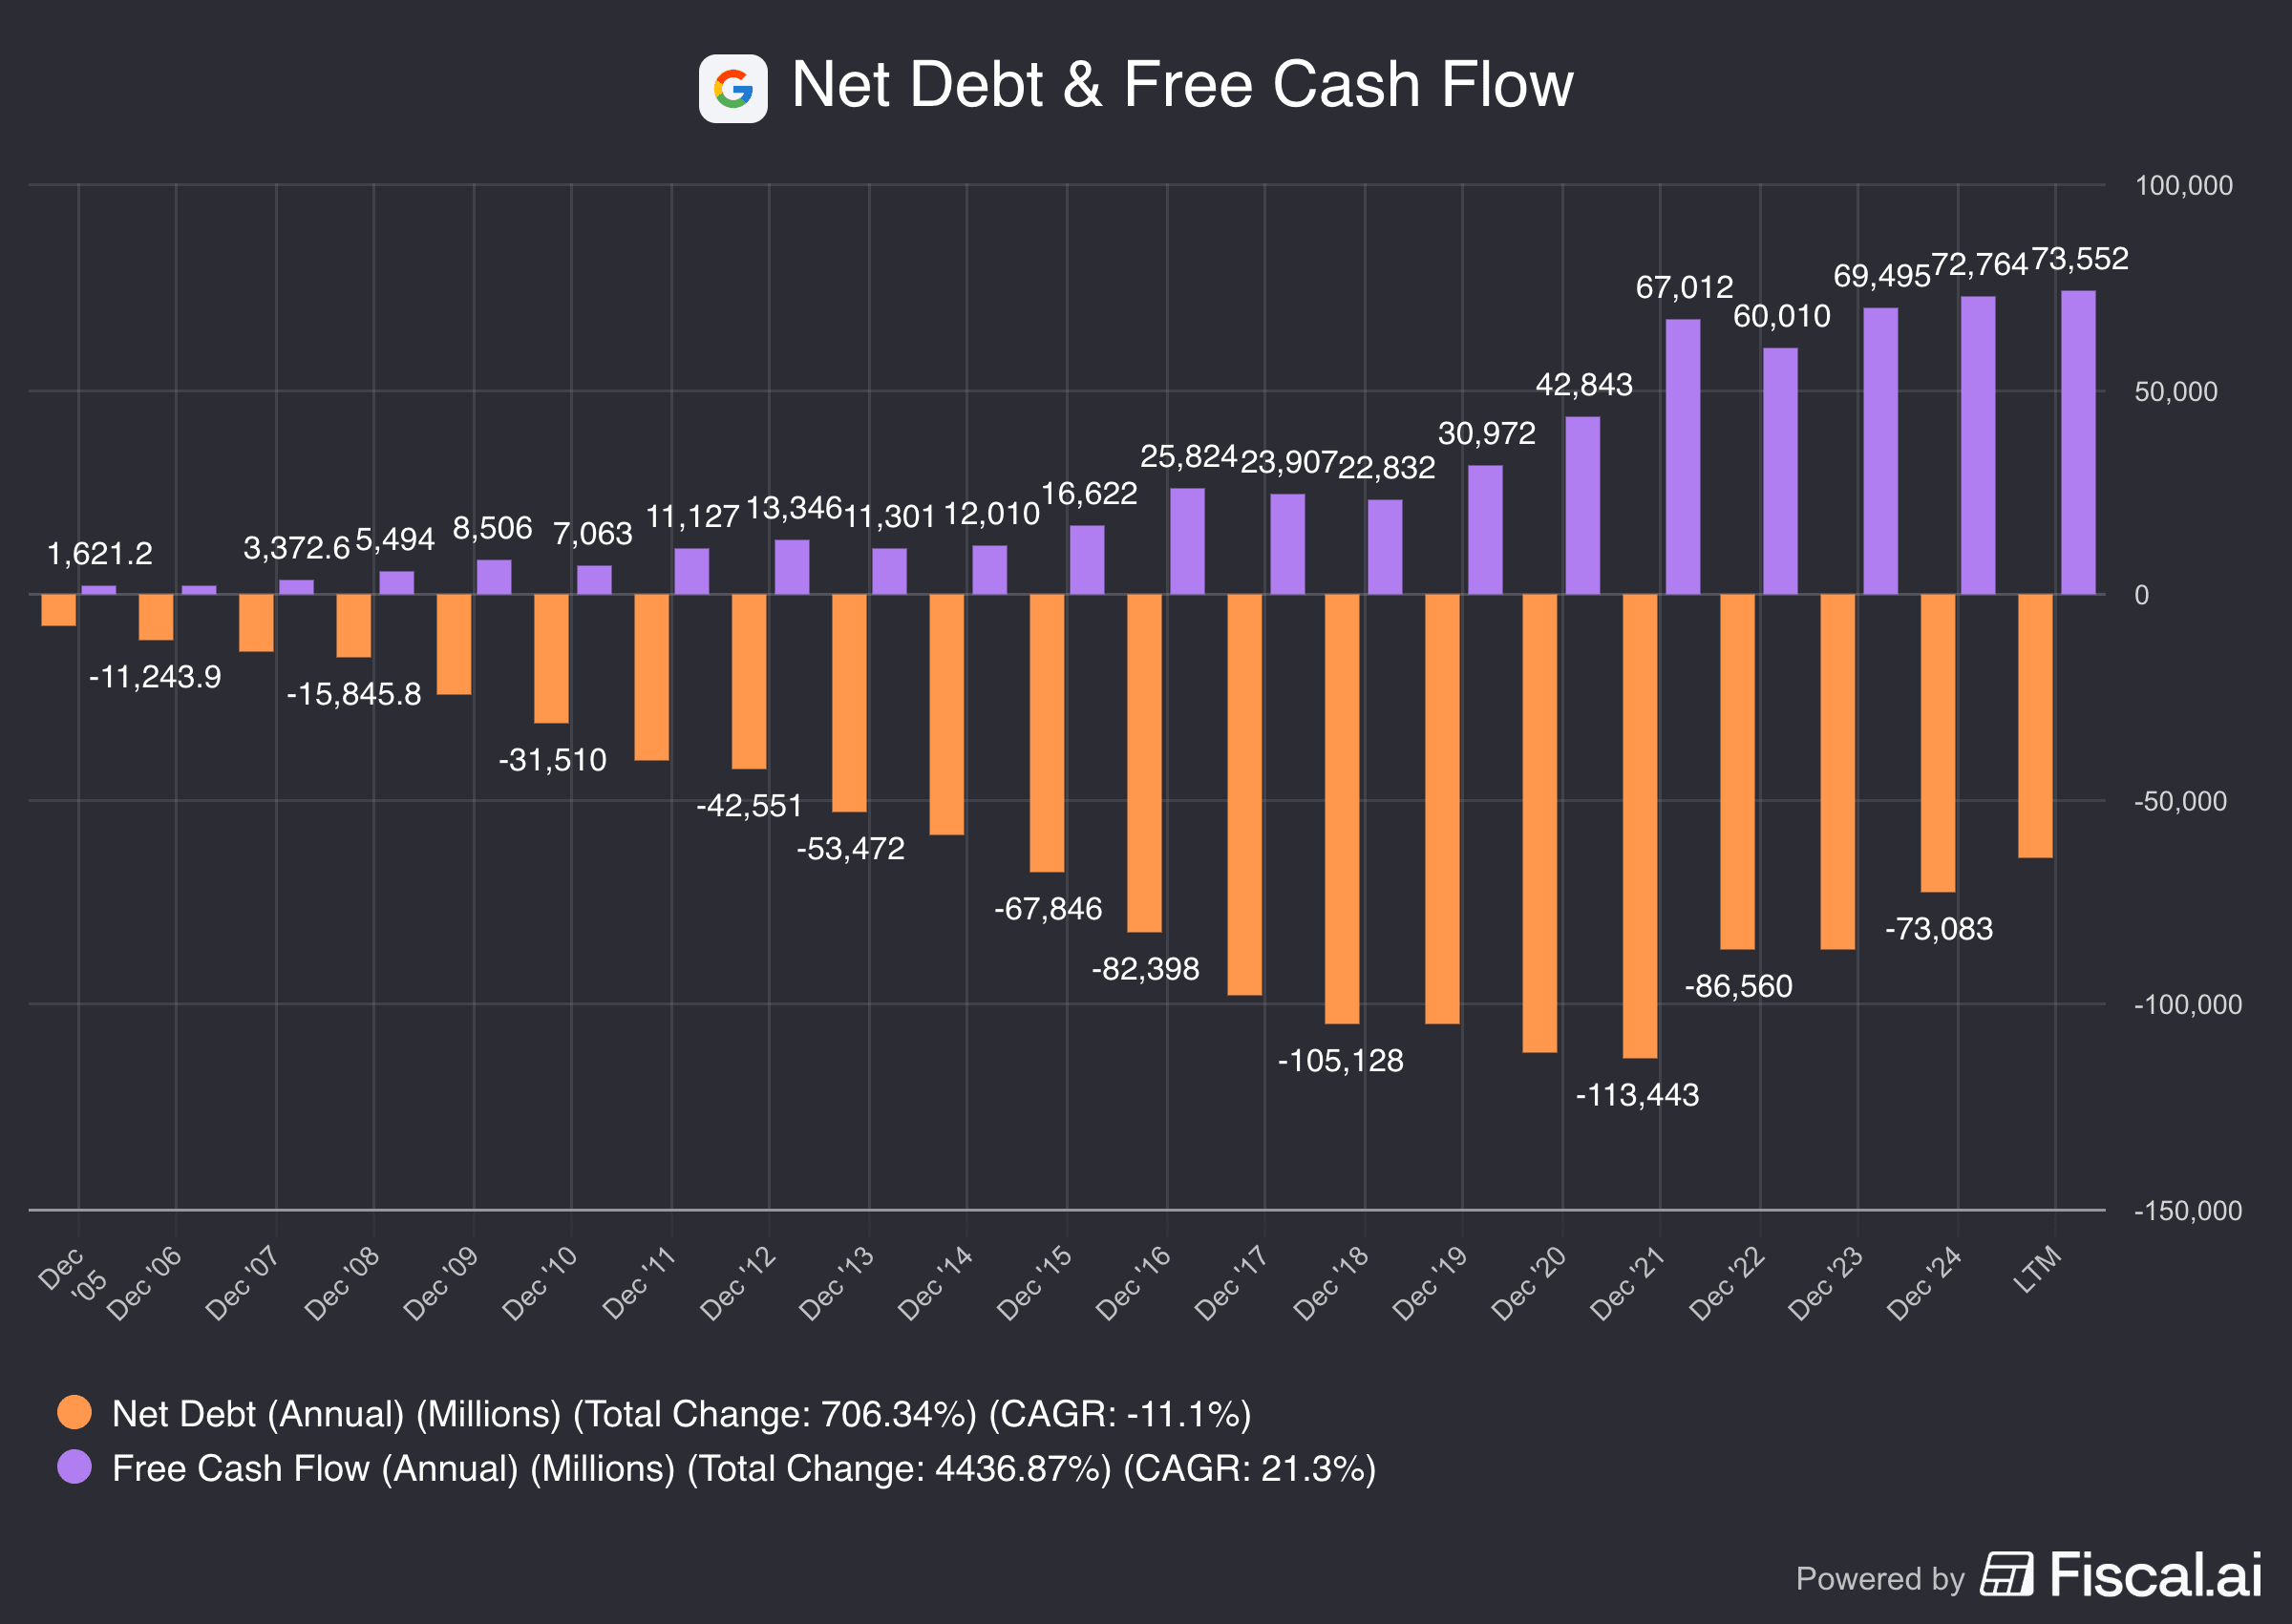
6. Does the company have a healthy balance sheet?
We look at 3 ratios to determine the healthiness of Google’s balance sheet:
Interest Coverage: 256.4x (Interest Coverage > 15x? ✅)
Net Debt/FCF: Net cash position equal to 1.5% of total Market Cap (Net Debt/FCF < 4x? ✅)
Goodwill/Assets: 6.2% (Goodwill/assets not too large? < 20% ✅)
The company’s balance sheet looks very healthy.
7. Does the company need a lot of capital to operate?
We prefer to invest in companies with CAPEX/Sales lower than 5% and CAPEX/Operating Cash Flow lower than 25%.
Google:
CAPEX/Sales: 20.2% (CAPEX/Sales < 5%? ❌)
CAPEX/Operating Cash Flow: 51.6% (CAPEX/Operating CF? < 25% ✅)
Doesn’t look good, right?
High capital intensity is only bad when the company isn’t investing in future growth.
When we only take maintenance CAPEX into account, we get the following:
Maintenance CAPEX/Sales: 5.0% (CAPEX/Sales < 5%? ❌)
Maintenance CAPEX/Operating Cash Flow: 12.7% (CAPEX/Operating CF? < 25% ✅)
These numbers look very reasonable.
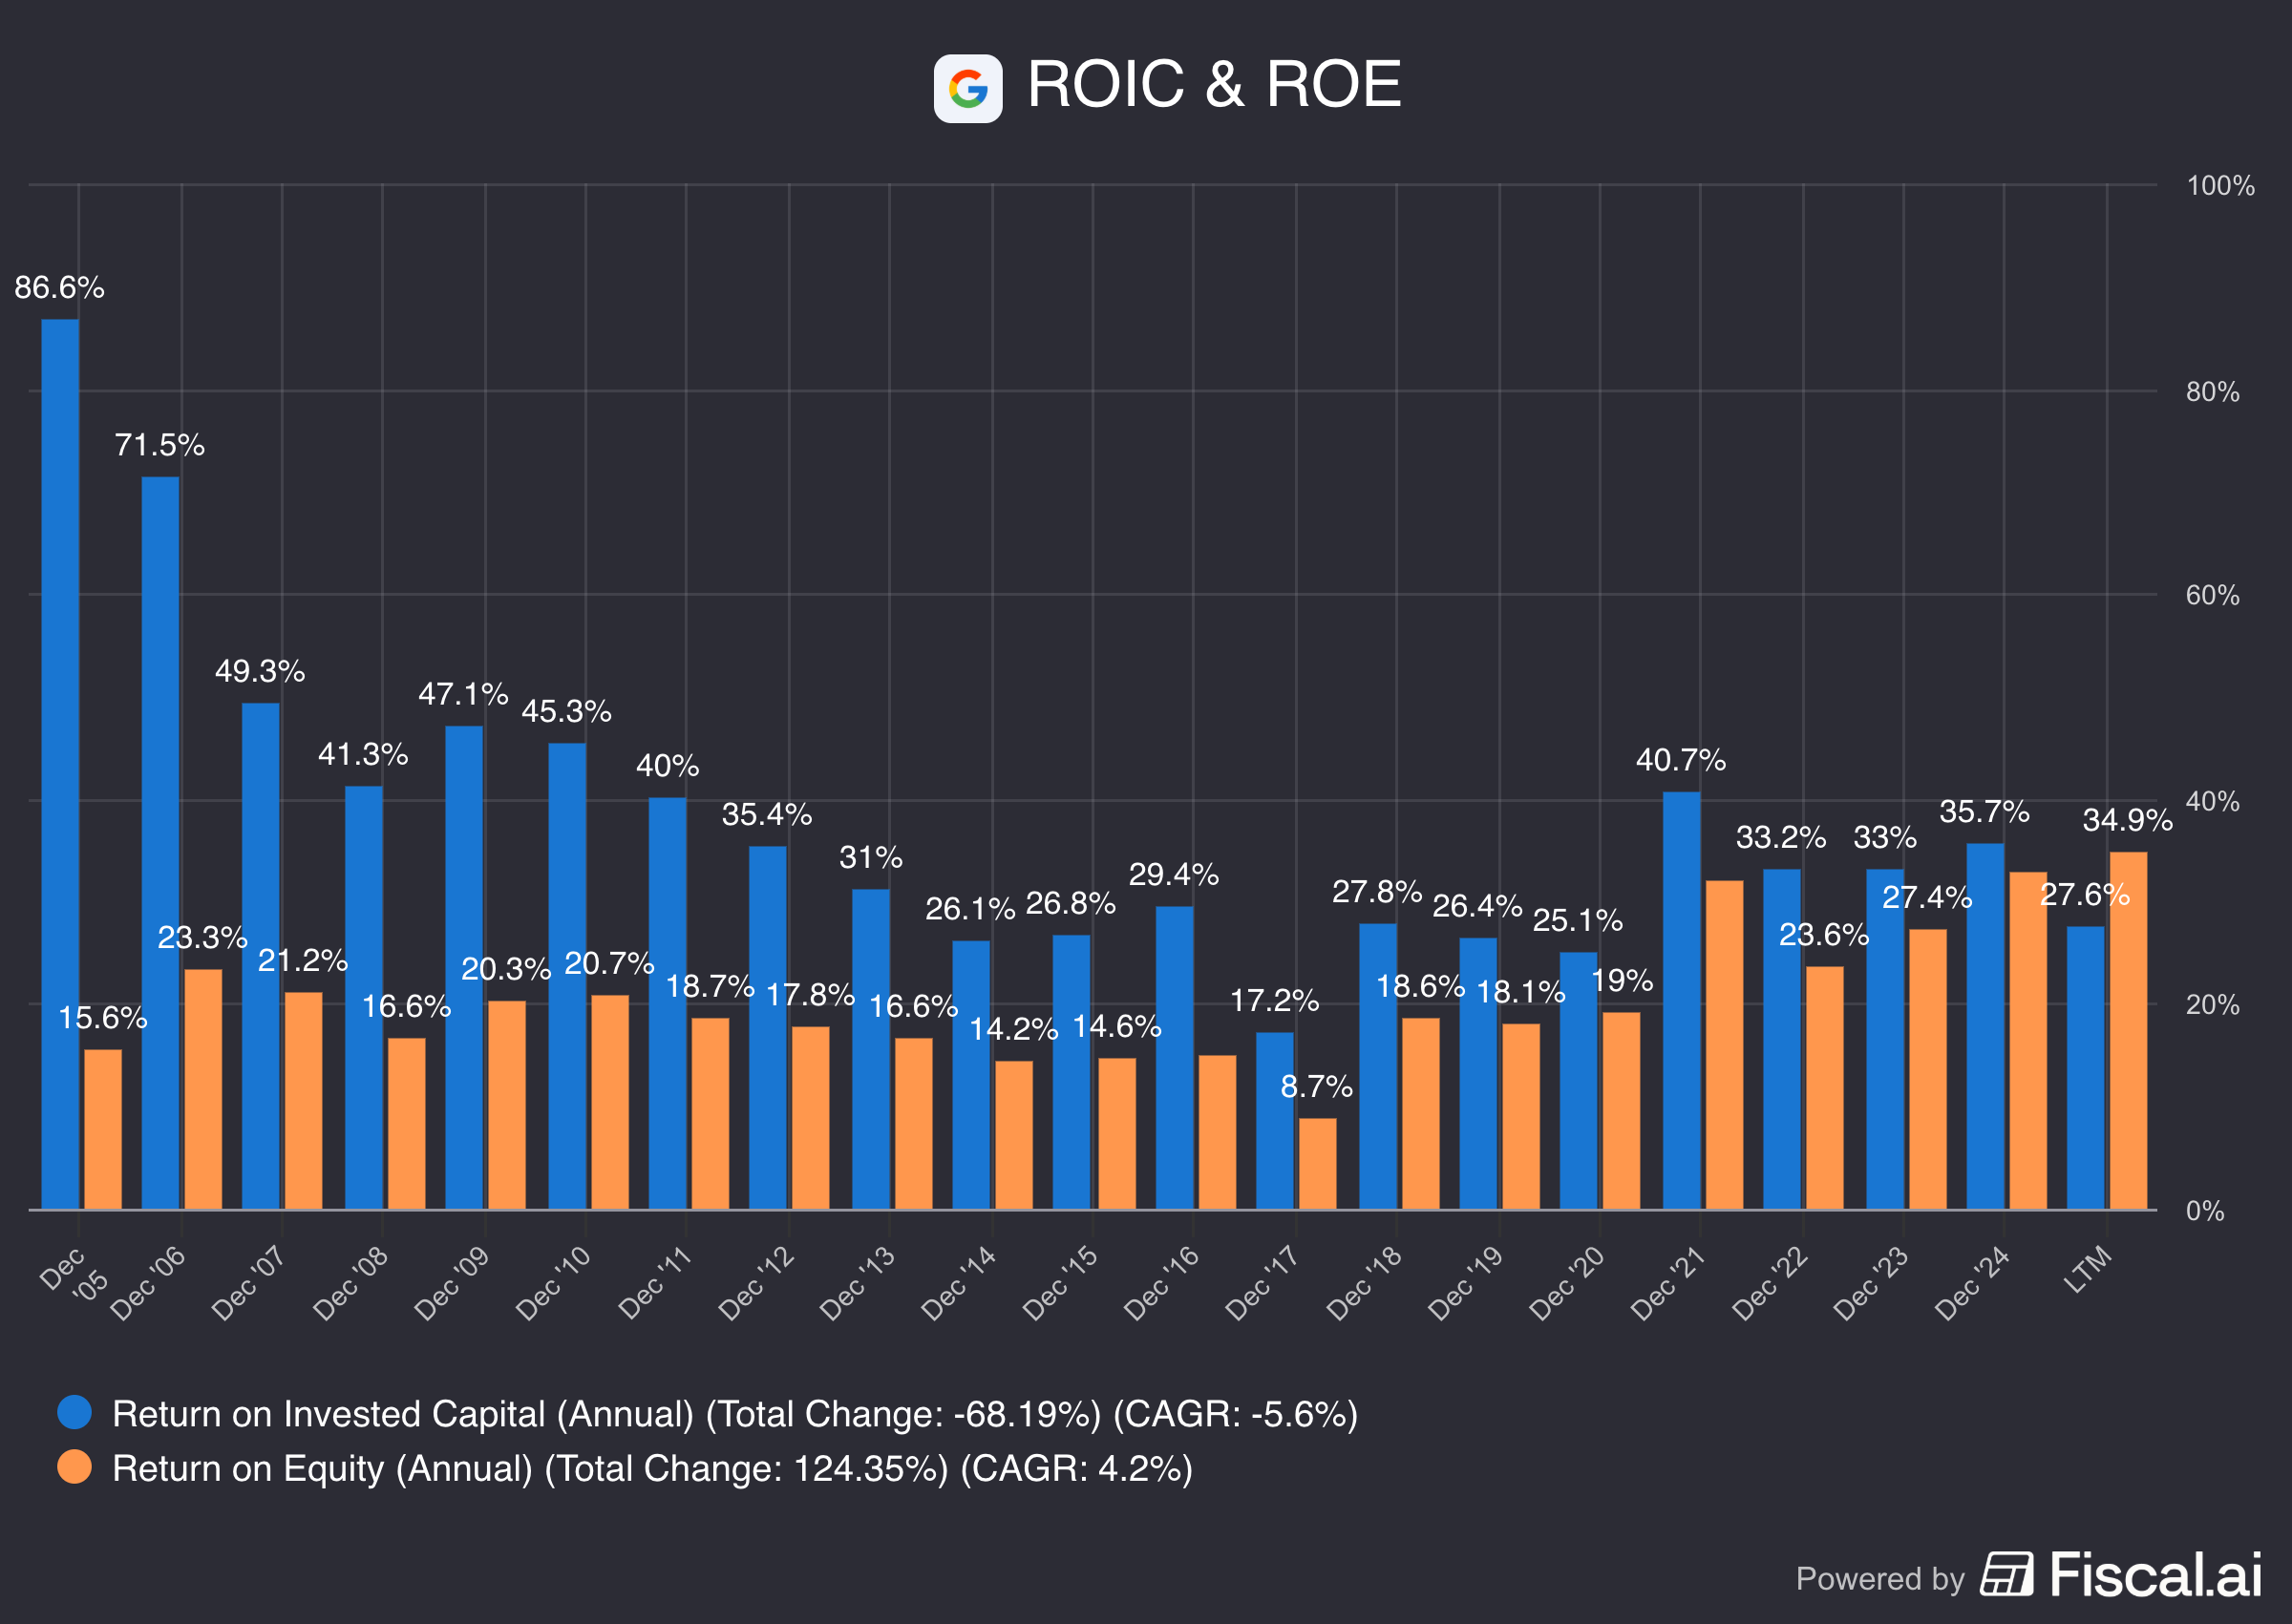
8. Is the company a great capital allocator?
Capital allocation is the most important task of management.
Look for companies that put the money of shareholders to work at attractive rates of return.
Google:
Return On Equity (ROE): 34.9% (ROE > 20%? ✅)
Return On Invested Capital (ROIC): 27.6% (ROIC > 15%? ✅)
These capital allocation metrics look attractive.
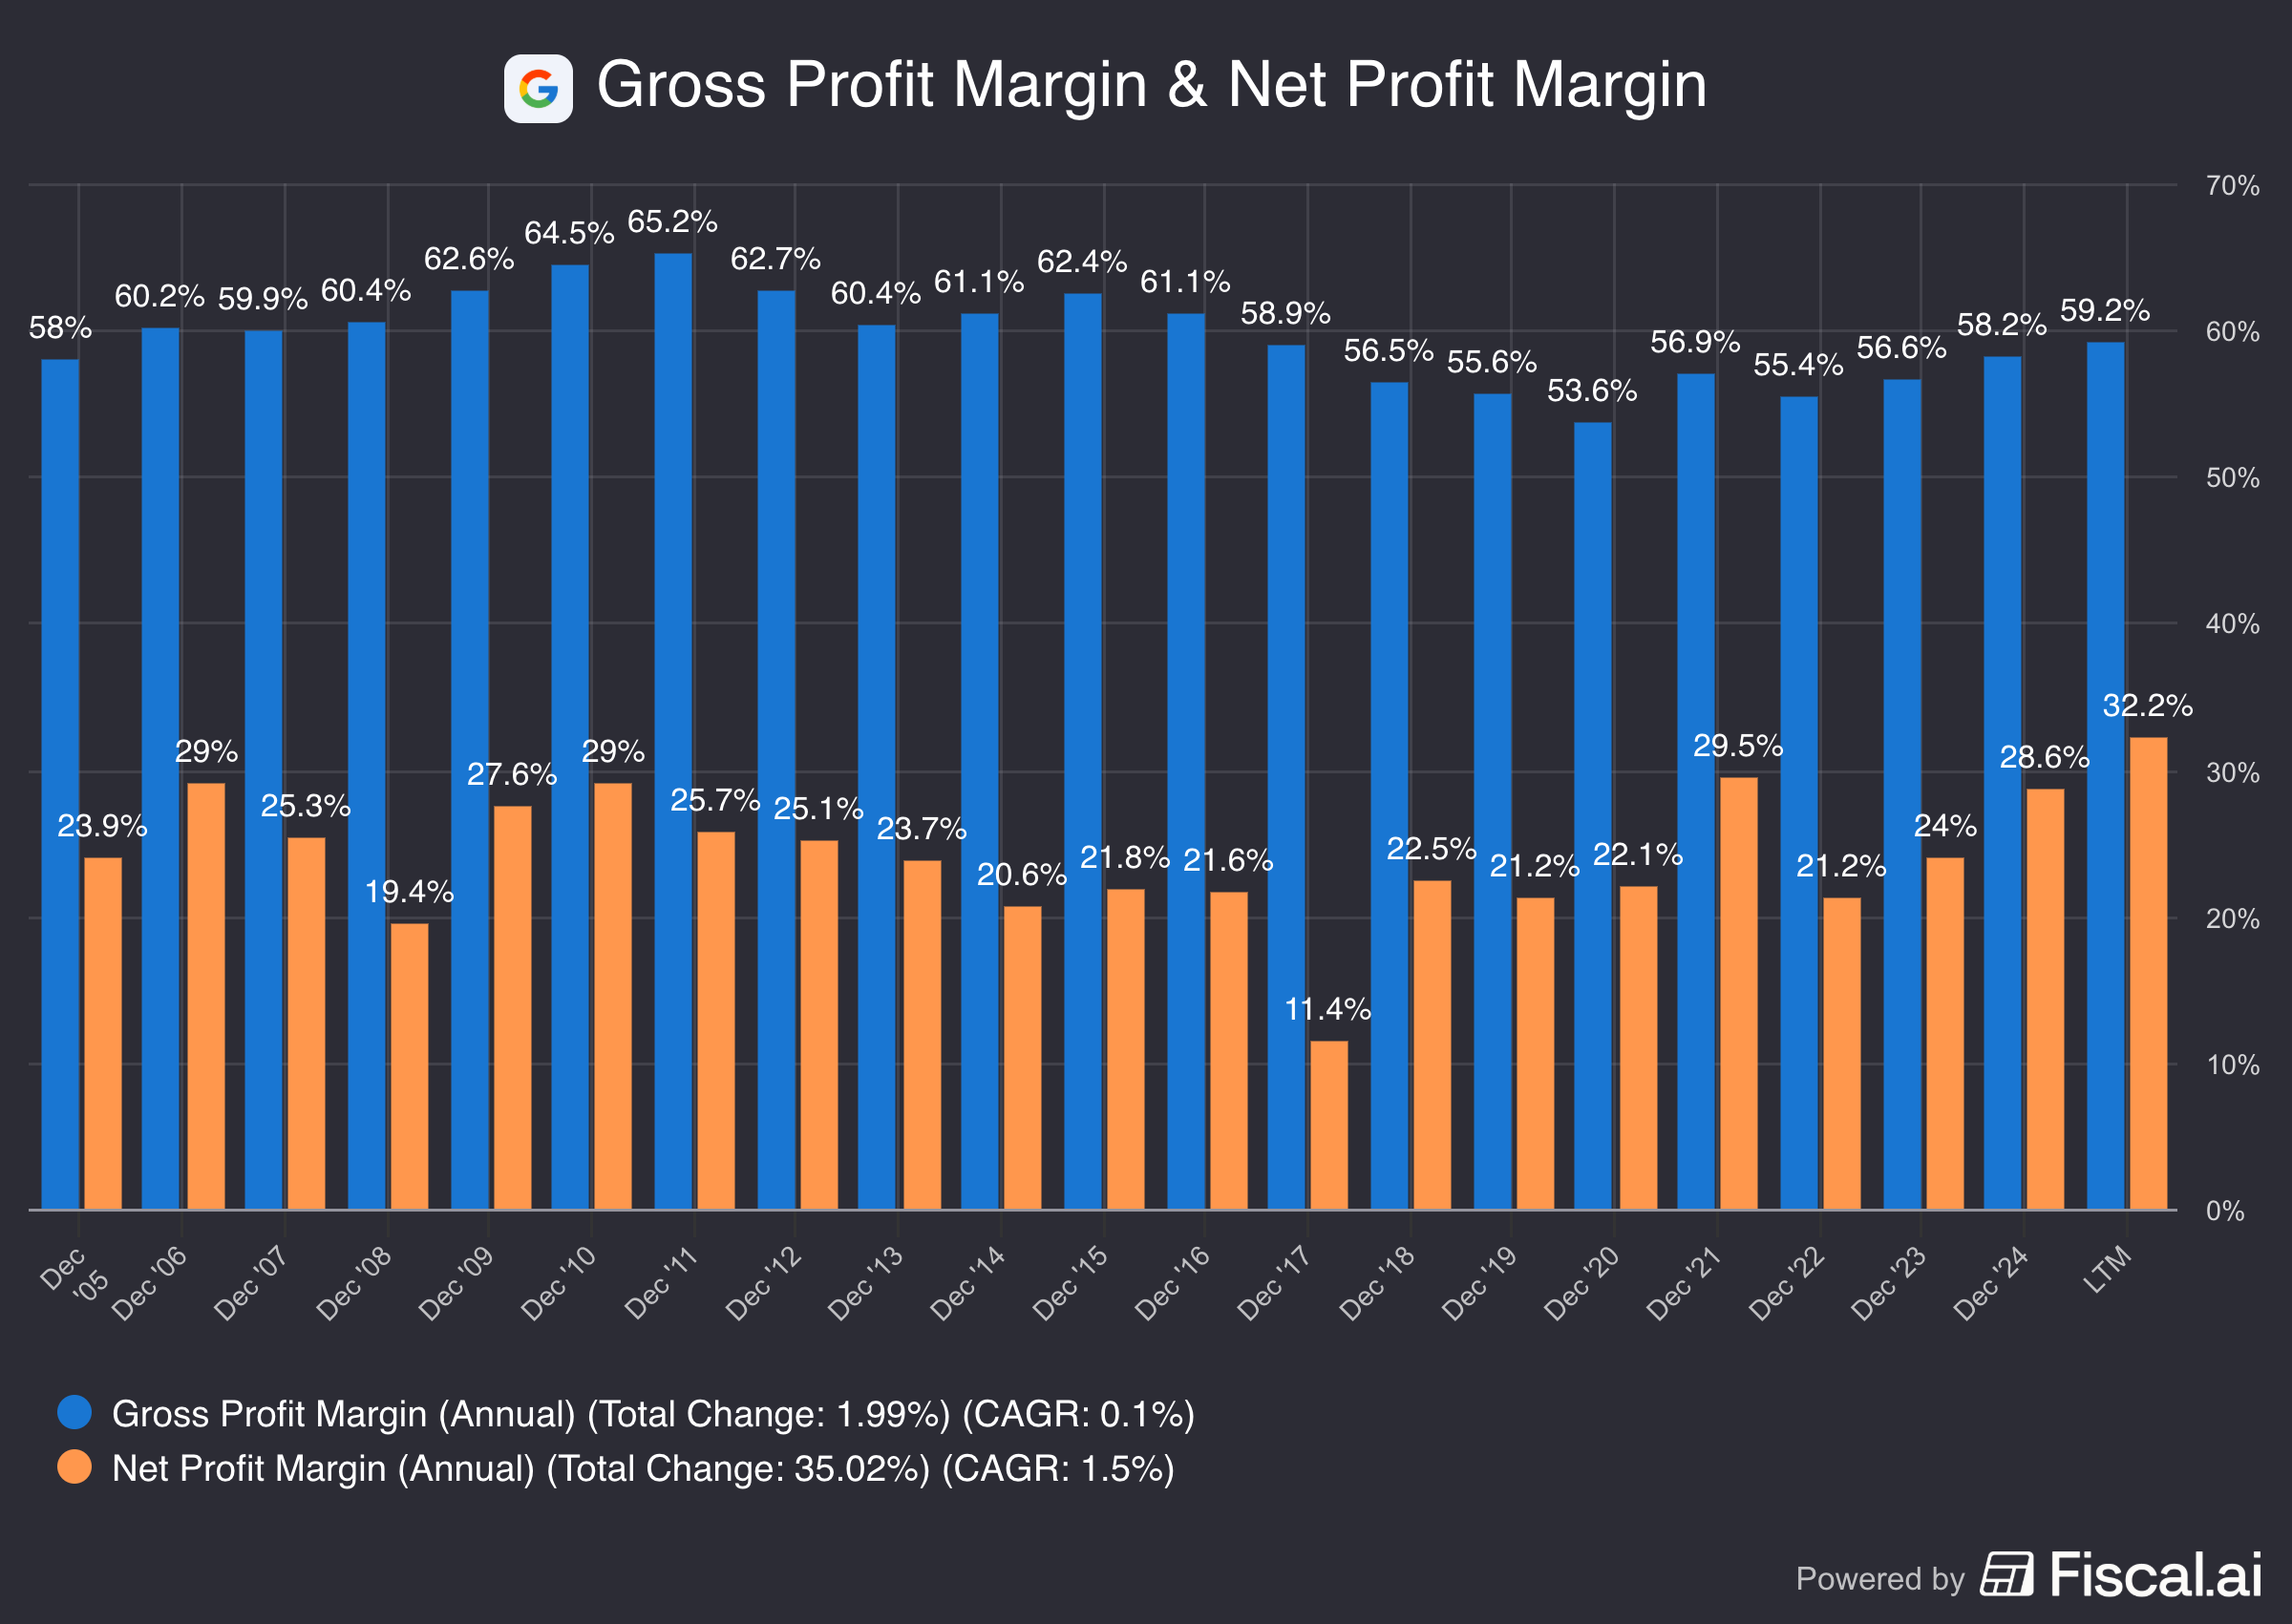
9. How profitable is the company?
The higher the profitability of the company, the better.
Here’s what things look like for Google:
Gross Margin: 59.2% (Gross Margin > 40%? ✅)
Net Profit Margin: 32.2% (Net Profit Margin > 10%? ✅)
FCF/Net Income: 59.2% (FCF/Net Income > 80%? ❌)
Google is a very profitable company.
The low FCF/Net Income can be explained by the heavy reinvestments in future growth Google is making.
10. Does the company use a lot of Stock-Based Compensation?
Stock-based compensation is a cost for shareholders and should be treated accordingly.
Preferably we want SBCs as a % of Net Income to be lower than 4% and certainly below 10%.
Google:
SBCs as a % of Net Income: 18.9% (SBCs/Net Income < 10%? ❌)
Avg. SBC as a % of Net Income past 5 years: 25.3% (SBCs/Net Income < 10%? ❌)
Google uses a lot of SBCs. We will take this into account in our valuation model later on.
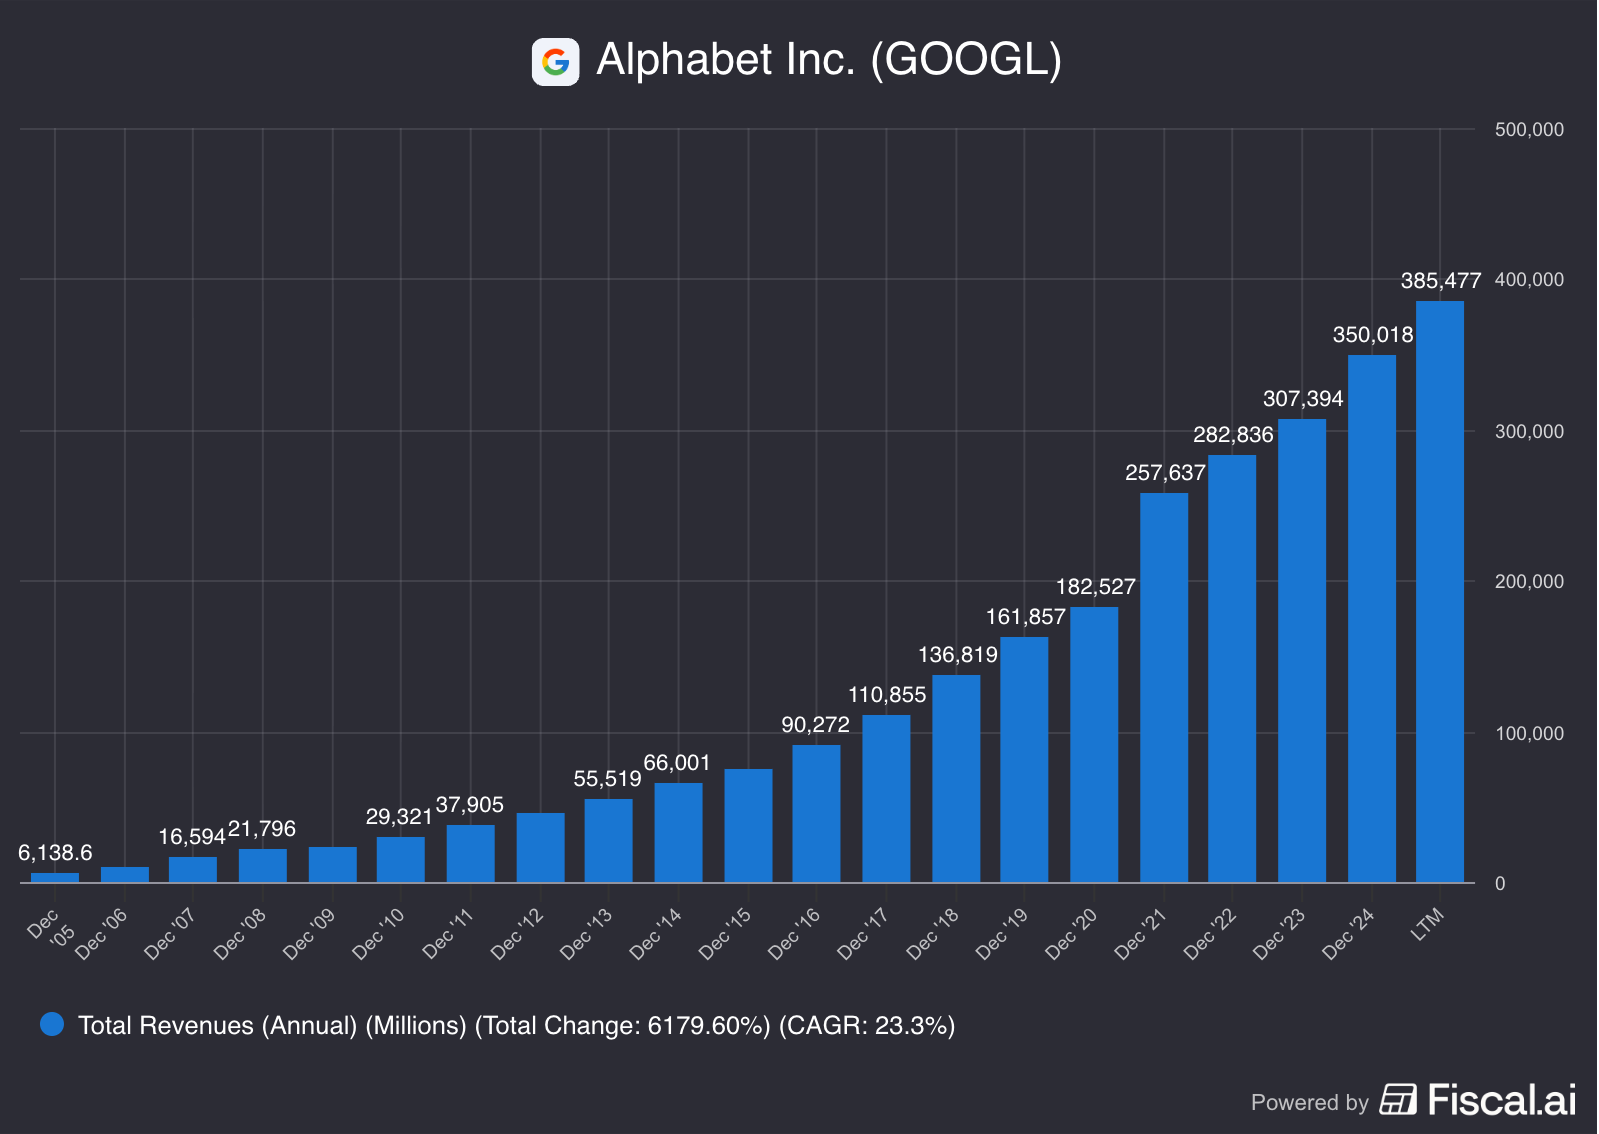
11. Did the company grow at attractive rates in the past?
We seek companies that managed to grow their revenue and EPS by at least 5% and 7% per year, respectively.
Google:
Revenue Growth past 5 years (CAGR): 17.6% (Revenue growth > 5%? ✅)
Revenue Growth past 10 years (CAGR): 18.3% (Revenue growth > 5%? ✅)
EPS Growth past 5 years (CAGR): 31.4% (FCF growth > 7%? ✅)
EPS Growth past 10 years (CAGR): 24.1% (FCF growth > 7%? ✅)
These growth figures look attractive.
12. Does the future look bright?
You want to invest in companies that manage to grow at attractive rates, as stock prices tend to follow EPS growth over time.
Google:
Exp. Revenue Growth next 2 years (CAGR): 13.8% (Revenue growth > 5%? ✅)
Exp. EPS Growth next 2 years (CAGR): 17.7% (EPS growth > 7%? ✅)
EPS Long-Term Growth Estimate: 15.1% (EPS growth > 7%? ✅)
The company should be able to keep growing at attractive rates.
13. Does the company trade at a fair valuation level?
We always use 3 methods to look at the valuation of a company:
A comparison of the forward PE multiple with its historical average
Earnings Growth Model
Reverse Discounted-Cash Flow
A comparison of the multiple with the historical average
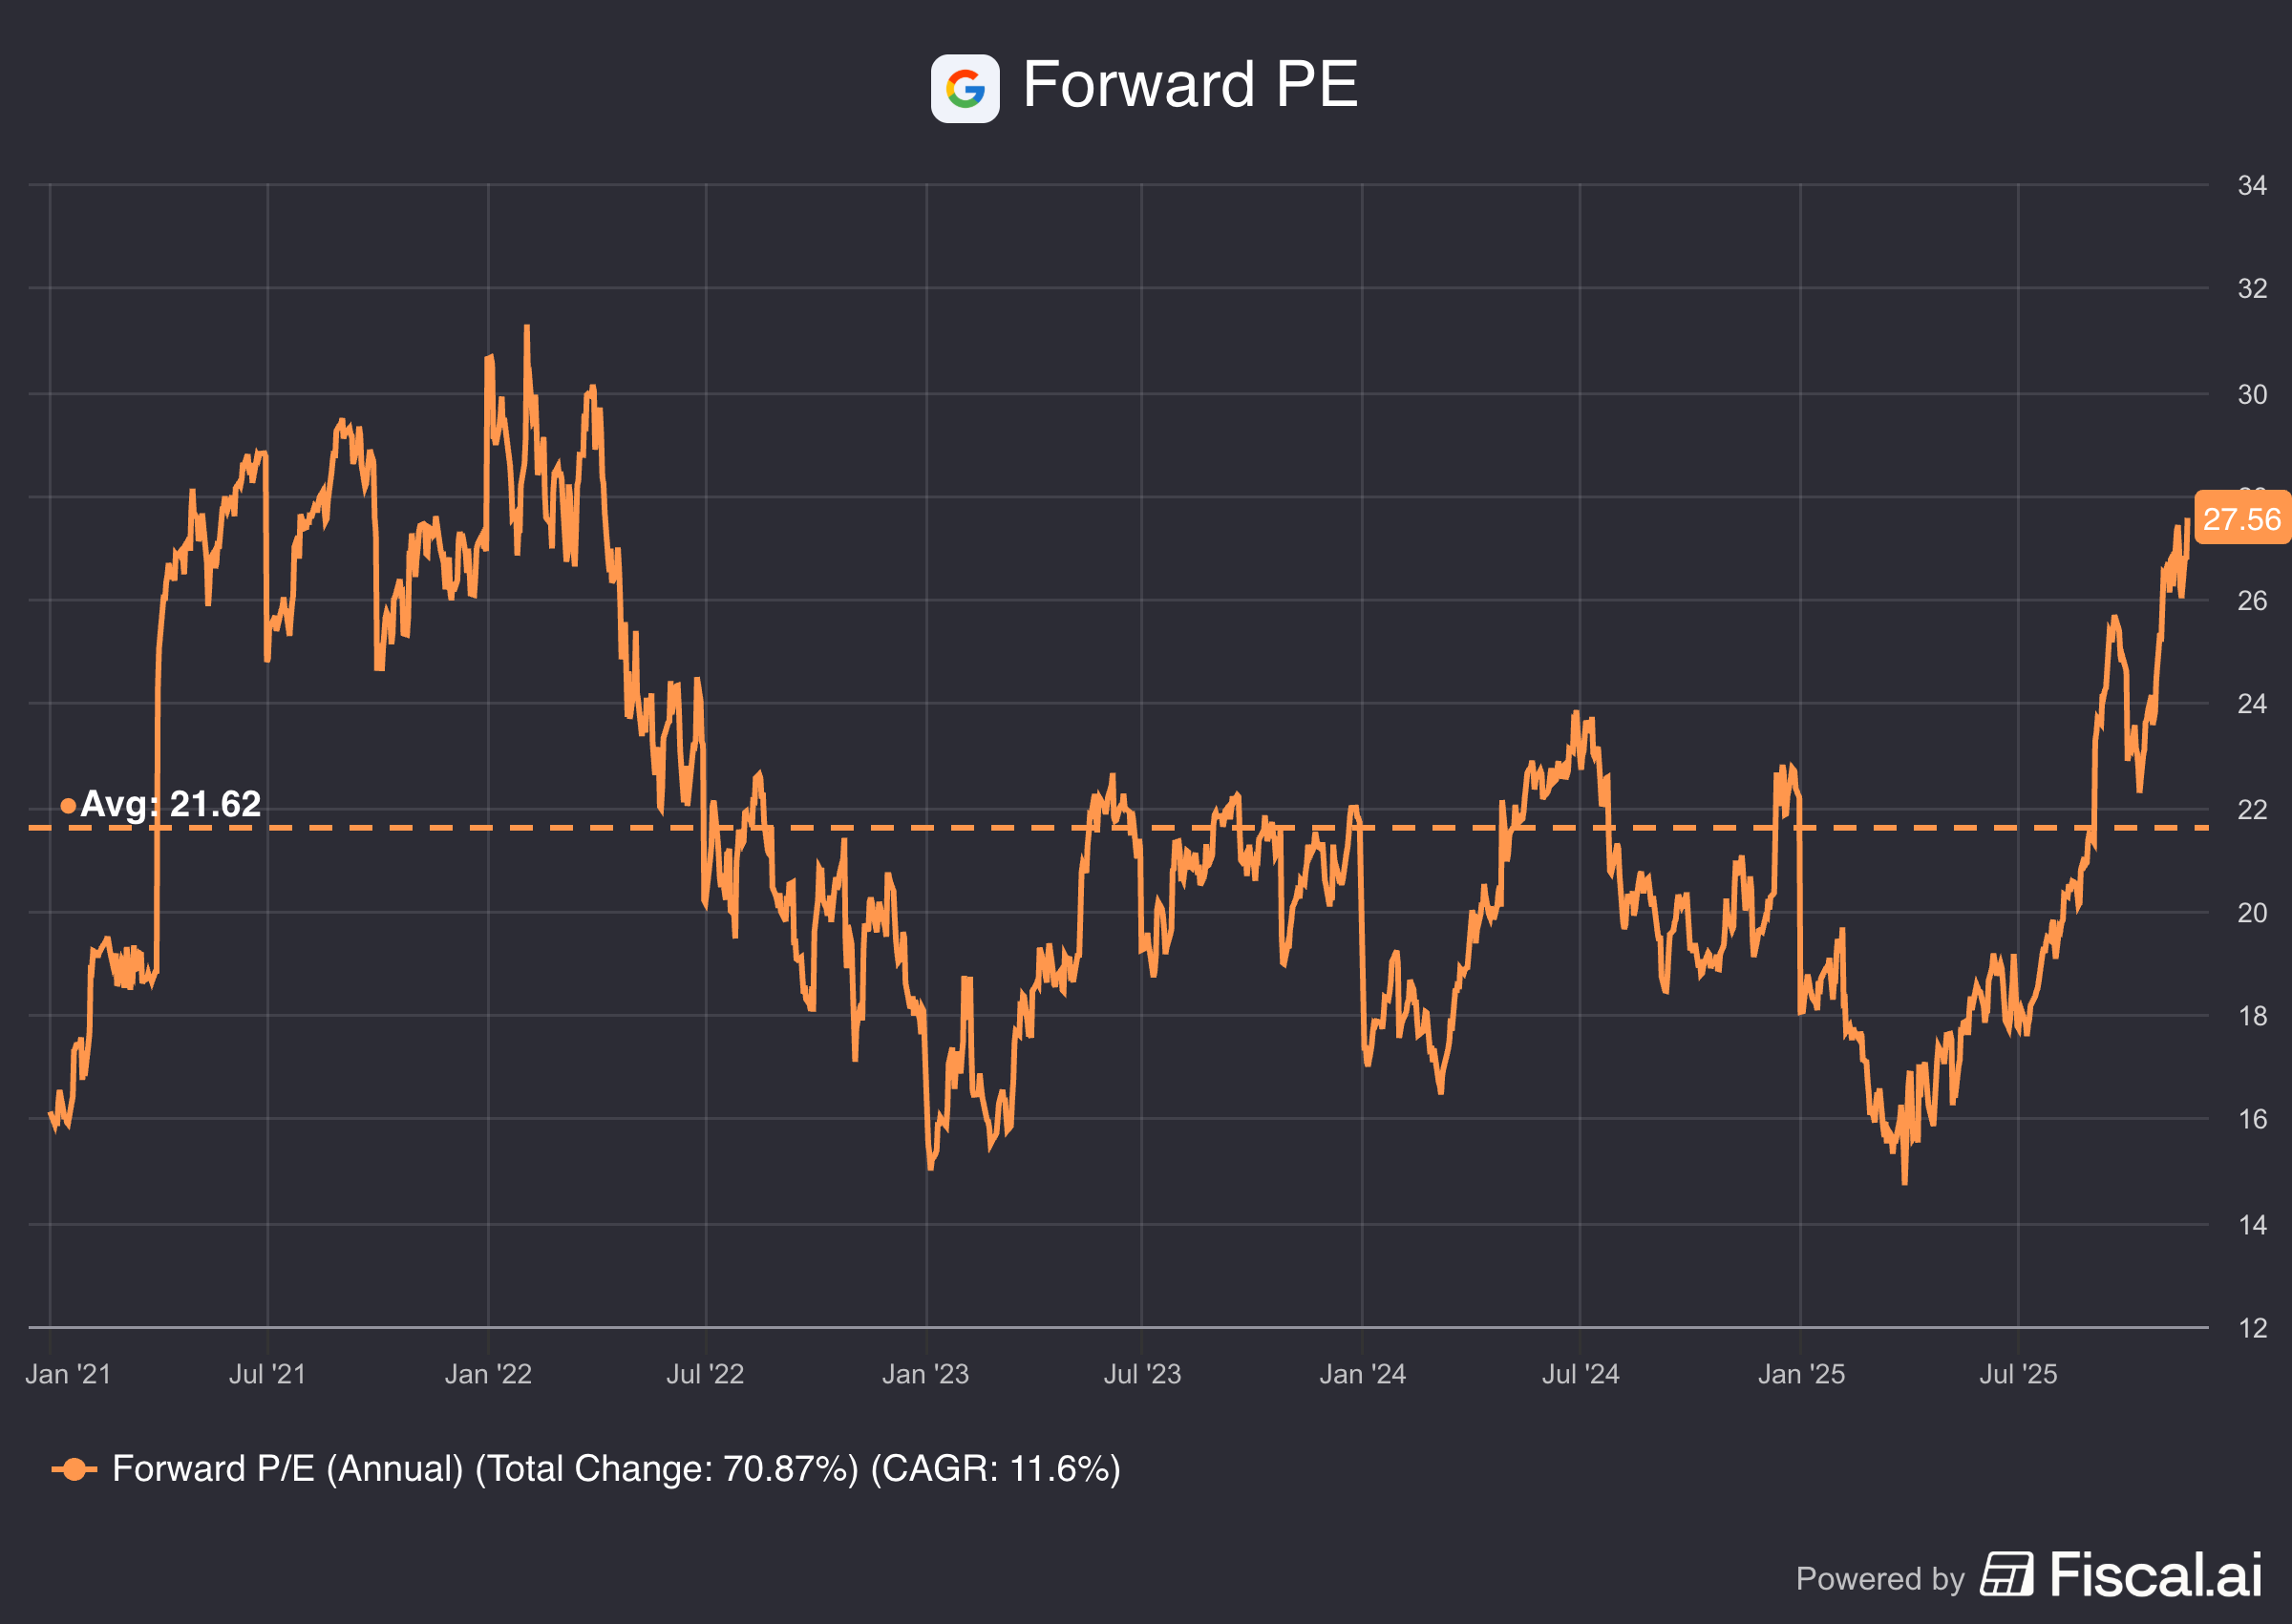
The first thing we do is compare the current forward PE with its historical average.
Today, Google trades at a forward PE of 27.6x versus a historical average of 21.6x over the past five years.
This indicates that the company is overvalued compared to its own historical average.
Earnings Growth Model
This model shows you the yearly return you can expect as an investor.
In theory, it’s easy to calculate your expected return:
Expected return = EPS growth + Dividend Yield +/- Multiple Expansion (Contraction)
Here are the assumptions I use:
EPS Growth = 12% per year over the next 10 years
Dividend yield = 0.3%
Forward PE to decline from 27.6x to 20x
Expected yearly return = 12.0% + 0.3% + 0.1*((20.0x – 27.6x)/27.6x)) = 9.5%
The expected yearly return doesn’t meet our threshold of 10% per year.
Reverse DCF
Charlie Munger once said that if you want to find the solution to a complex problem, you should invert. Always invert. Turn the problem upside down.
A reverse DCF shows you the expectations implied in the current stock price.
You try to determine for yourself whether these expectations are realistic or not.
You can learn more about a reverse DCF here: Reverse DCF 101.
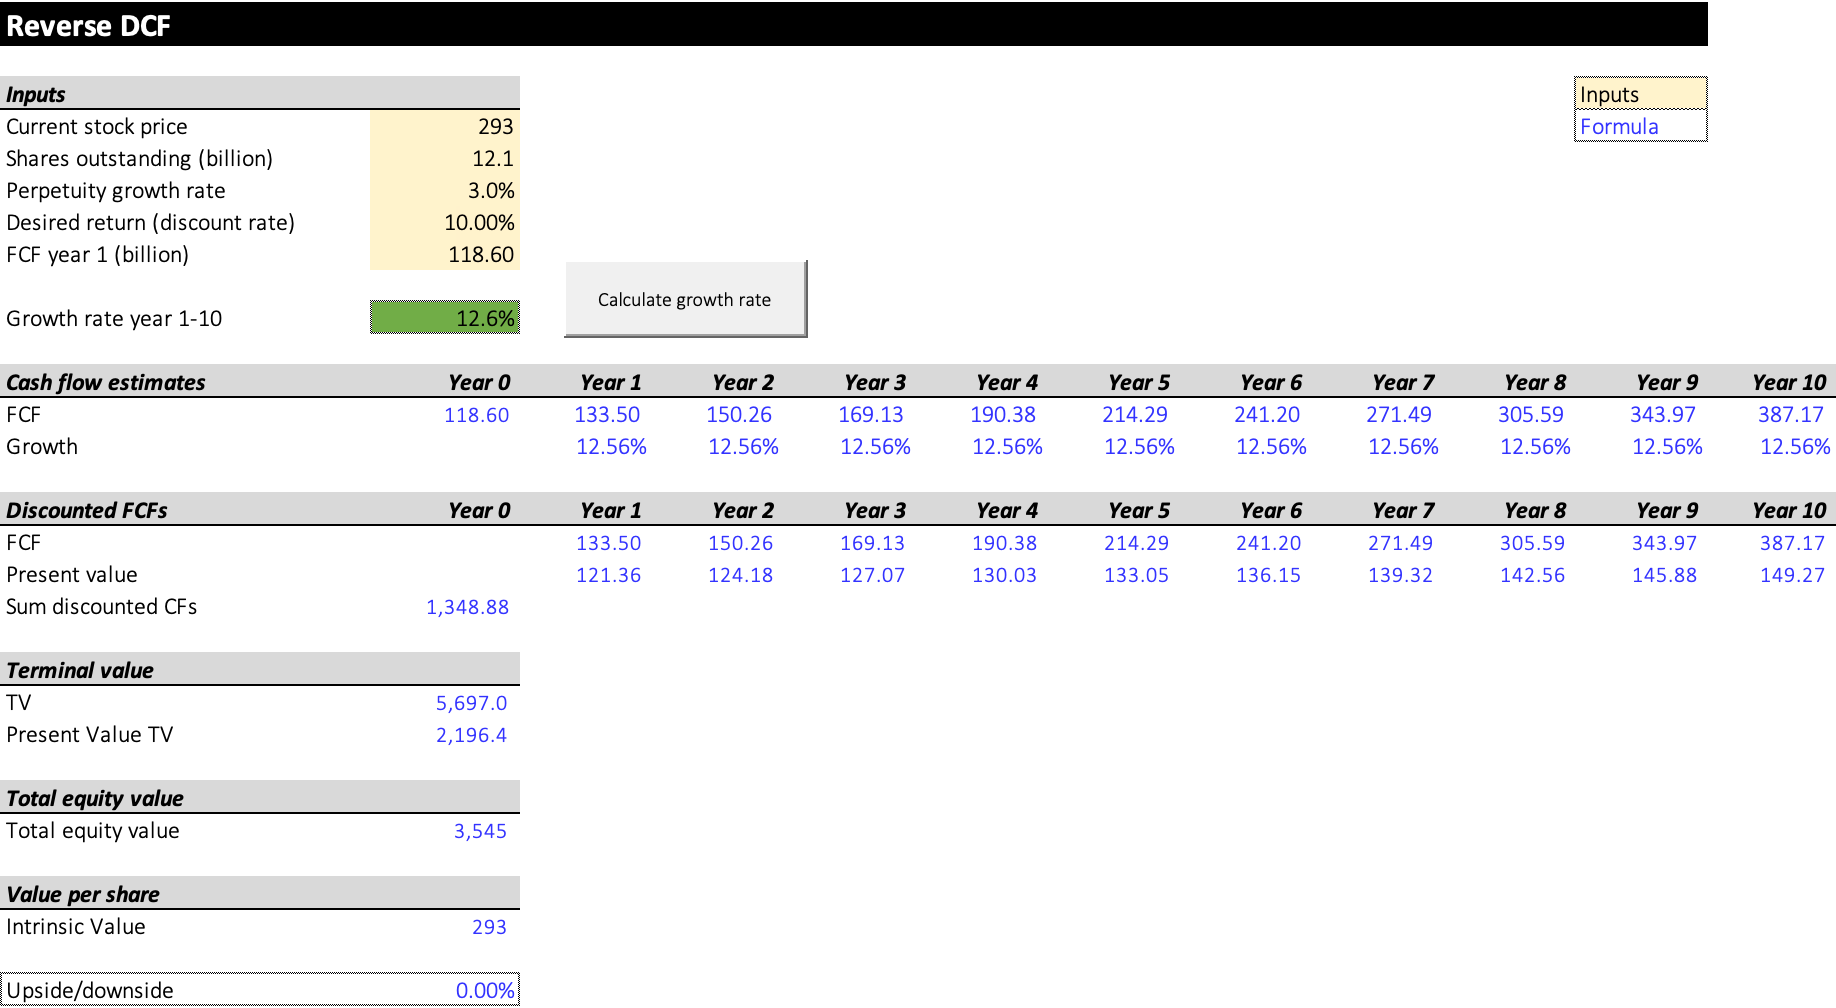
The consensus states that Google’s Free Cash Flow for 2026 will be equal to $83.7 billion. Today, the company has 12.1 billion shares outstanding.
We should adjust Free Cash Flow by adding growth CAPEX ($58.6 billion) and subtracting SBC costs ($23.7 billion).
The adjusted FCF is equal to $118.6 billion.
Under these assumptions, our Reverse DCF indicates that Google should grow its Free Cash Flow by 12.6% per year to return 10% per year to shareholders.
It’s possible that Google can grow its FCF by 12.6% but you can’t consider the company as ‘cheap’.
Google:
Forward PE: 27.6x (lower than its 10-year average? < 21.6x? ❌)
Earnings Growth Model: 9.5% (Yearly return? < 10%? ❌)
FCF-Growth Reverse DCF: 12.6% (Realistic growth expectations? ❓)
14. How did the Owner’s Earnings of the company evolve in the past?
Over time, stock prices tend to follow the Owner’s Earnings of a company (EPS Growth + Dividend Yield).
That’s why we want to invest in companies that managed to grow their Owner’s Earnings at attractive rates in the past. This is the case for Google.
Google:
CAGR Owner’s Earnings (5 years): 31.7% (CAGR Owner’s Earnings > 12%? ✅)
CAGR Owner’s Earnings (10 years): 24.4% (CAGR Owner’s Earnings > 12%? ✅)
15. Did the company create a lot of shareholder value in the past?
We want to invest in companies that managed to compound at attractive rates in the past.
Ideally, the company returned more than 12% per year to shareholders since its IPO.
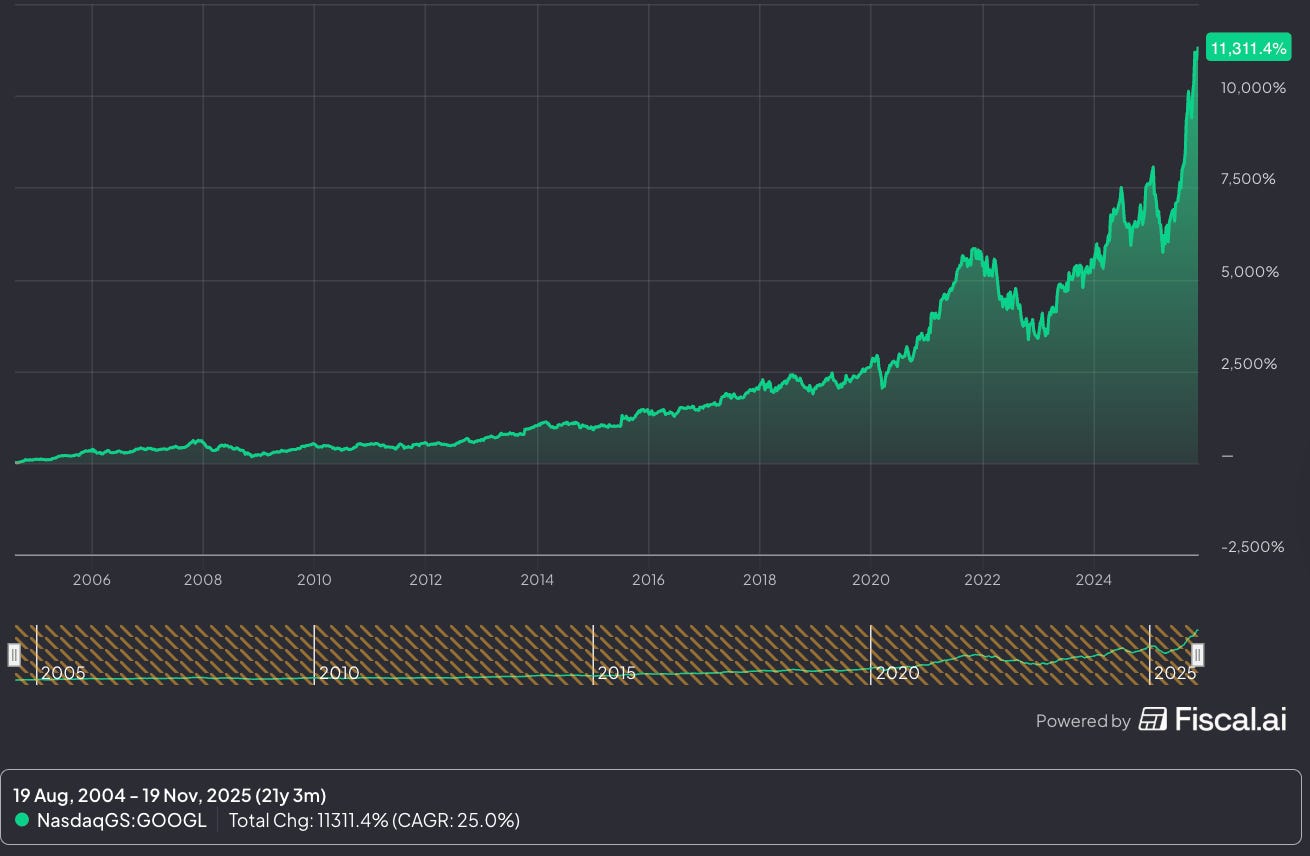
Here’s what the performance of the Big Tech company looks like:
YTD: +53.7%
5-year CAGR: +26.6%
CAGR since IPO (2004): +25.0% (CAGR since IPO > 12%? ✅)
Quality Score
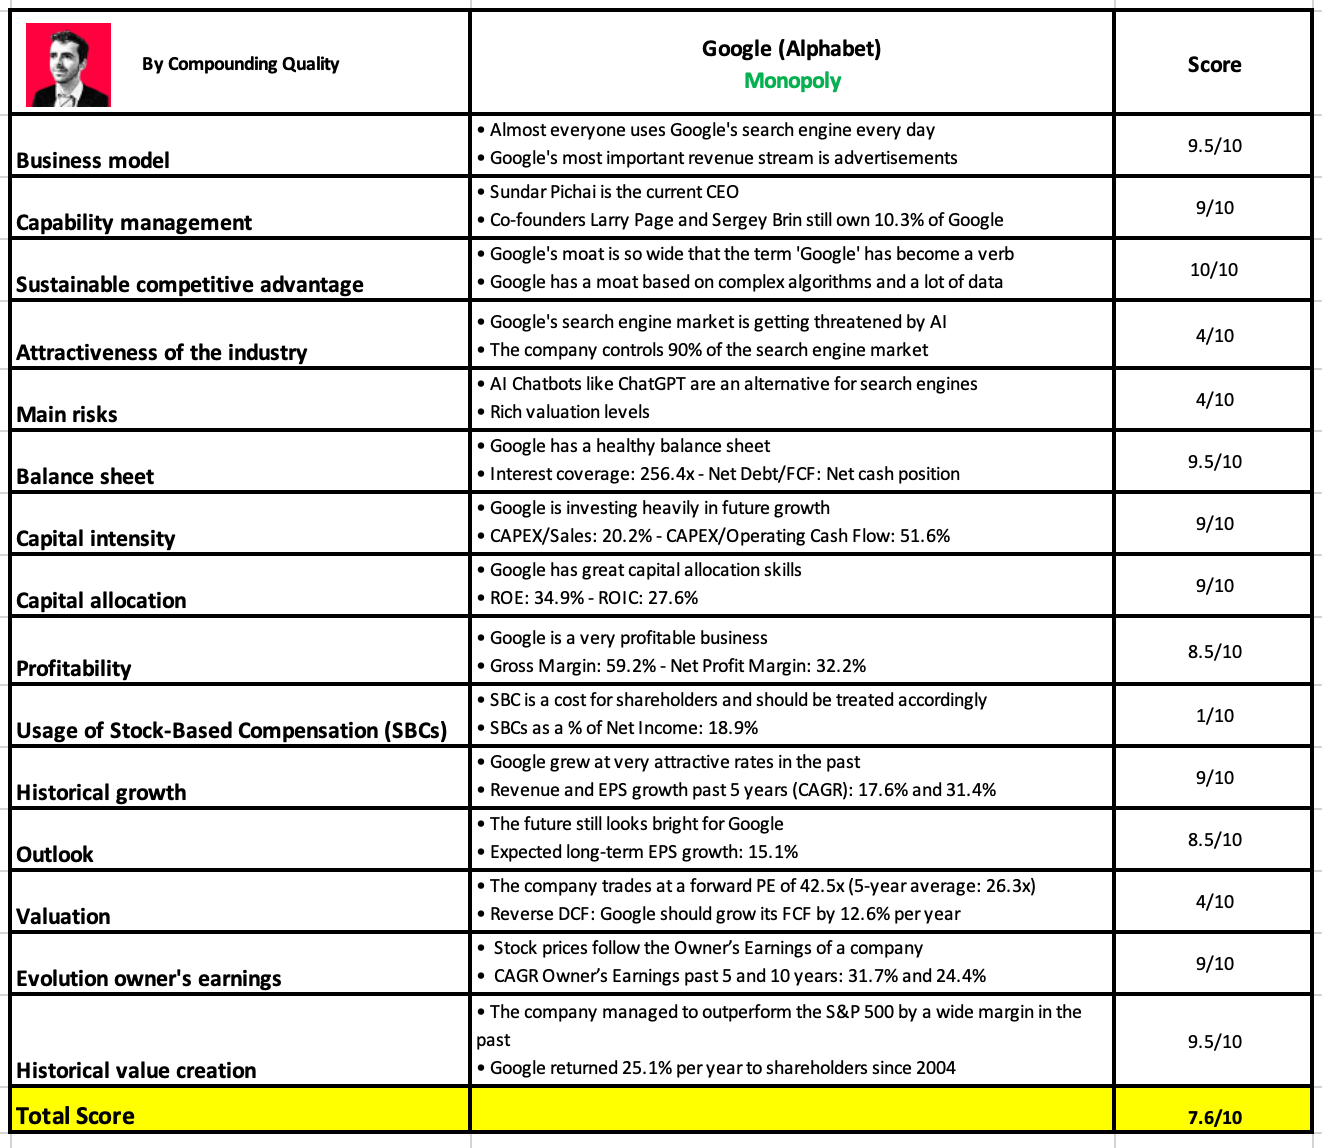
Finally, let’s bring everything together and give the company a Total Quality Score.
As you can see in the table below, Google gets a Total Quality Score of 7.6/10:
I totally get why Warren Buffett bought Google.
The company has a massive moat, high margins, a healthy balance sheet, and a strong brand.
But still… I think there are better opportunities out there right now.
Many high-quality stocks are currently on sale.
More on that this Sunday!
Everything in life compounds
Pieter (Compounding Quality)
PS You are not a Partner of Compounding Quality yet? Discover everything you need to know here.
Book
Order your copy of The Art of Quality Investing here
Used sources
Interactive Brokers: Portfolio data and executing all transactions
Fiscal.ai: Financial data
Interesting business review. There is maybe a small typo in your article
You compare EPS Growth and FCF Growth
"EPS Growth past 5 years (CAGR): 31.4% (FCF growth > 7%? ✅)
EPS Growth past 10 years (CAGR): 24.1% (FCF growth > 7%? ✅)"
Buffett obviously wasn't the one buying Google. If it were Buffett, it would have been $50B+.