
📈 Copart: the Nvidia of Wrecked Cars
Investment case Copart

Copart is one of the Greatest Compounders in the United States.
An investment of $10,000 in Copart turned into $3.2 million (!) since 1994.
Let’s teach you everything you need to know about this beautiful company.
Copart - General Information
👔 Company name: Copart
✍️ ISIN: US2172041061
🔎 Ticker: CPRT
📚 Type: Owner-Operator Stock
📈 Stock Price: $56.5
💵 Market cap: $54.6 billion
📊 Average daily volume: $207 million
Onepager
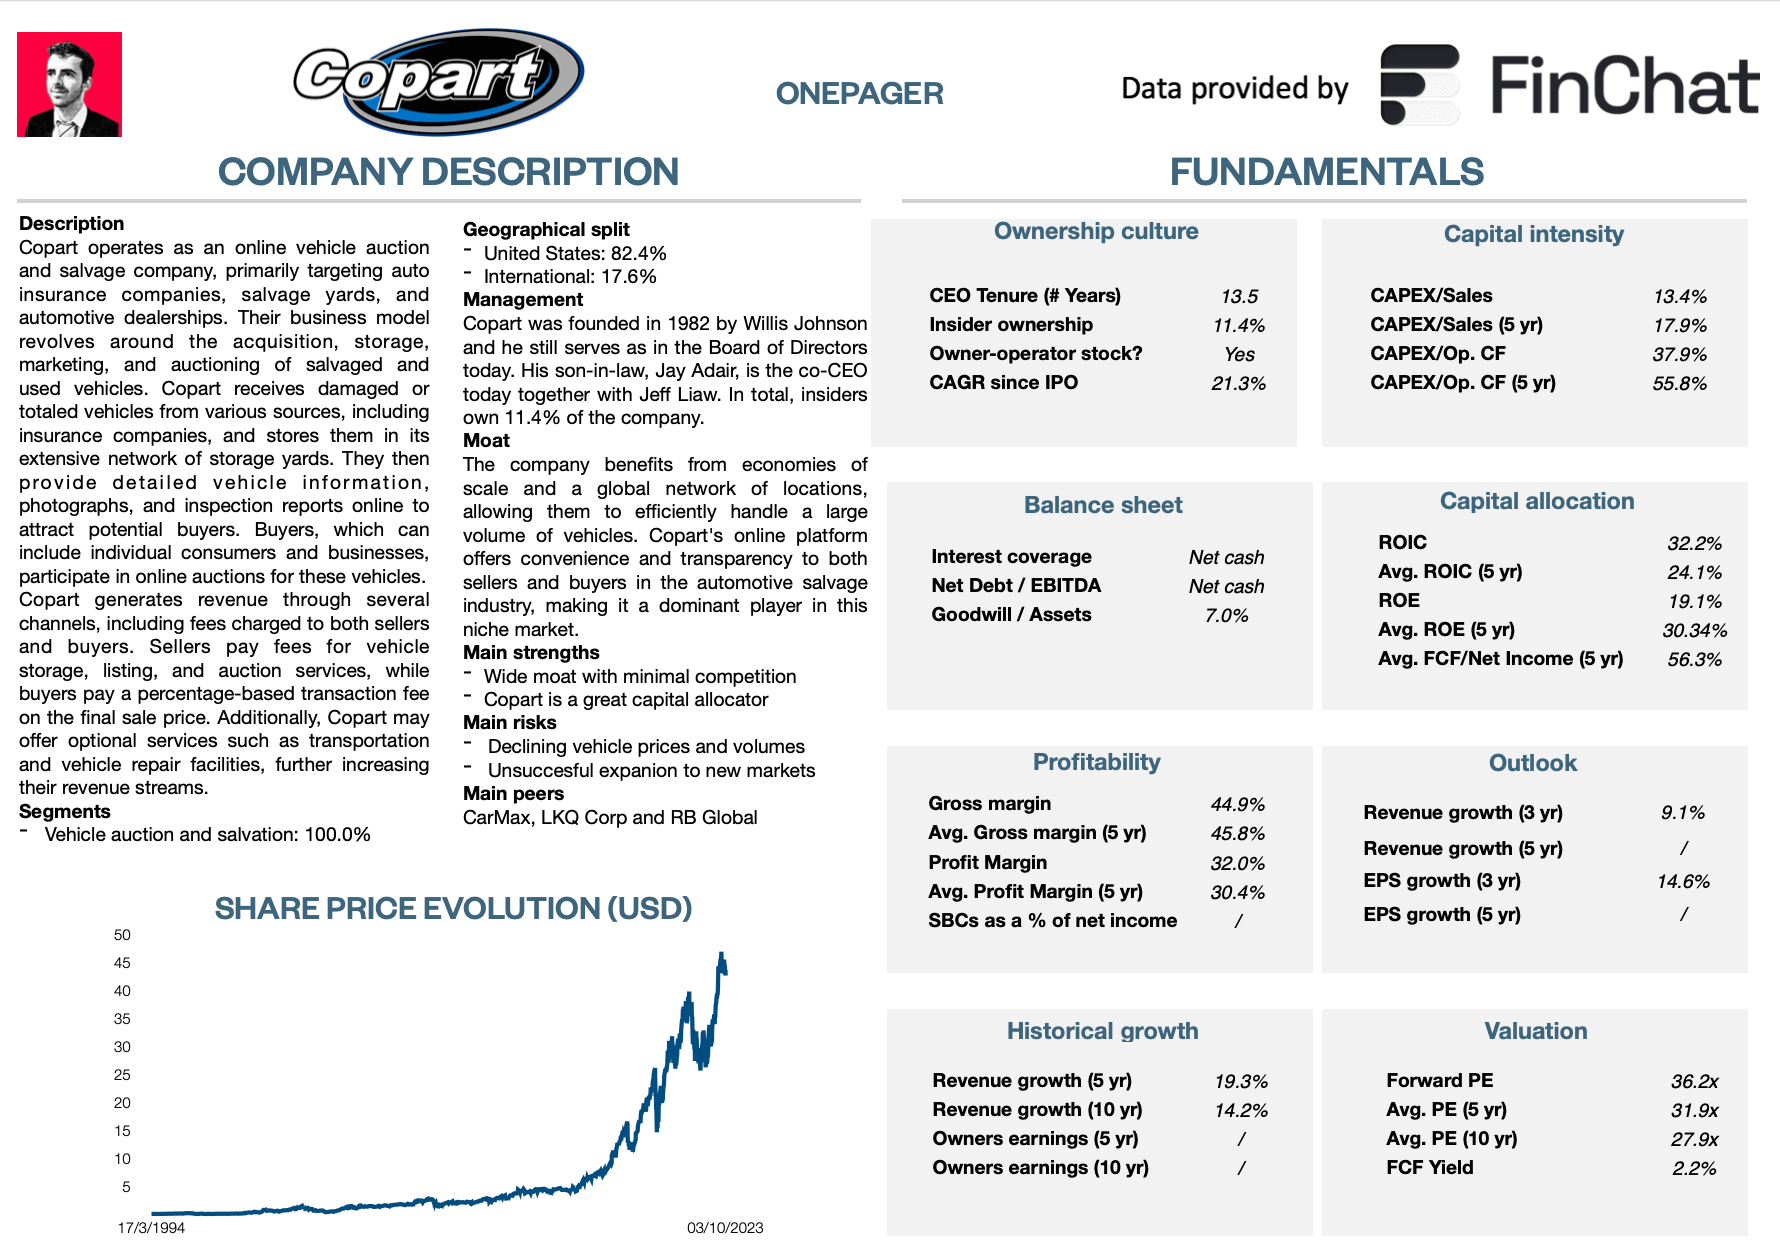
Here’s a onepager with the essentials of Copart:
(Click on the picture to expand)
15-Step Approach
Now let’s use our 15-step approach to analyze the company.
At the end of this article, we’ll give Copart a score on each of these 15 metrics, which will result in a Total Quality Score.
1. Do I understand the business model?
Copart makes money via online vehicle auctions. They are active in the buying and selling of used and salvage vehicles. Every day, Copart has more than 175,000 vehicles up for auction.
The American company makes money from fees charged to both buyers and sellers participating in its online auctions.
Sellers such as insurance companies, salvage yards, and individuals, enlist Copart's services to auction off damaged or surplus vehicles. Copart charges sellers listing fees and a percentage of the final sale price.
Buyers, including automotive dealers, dismantlers, and the general public, pay a buyer's premium on top of the winning bid.
Copart’s platform provides a global marketplace, connecting buyers and sellers across various regions.
The company employs a bidding system where buyers place competitive bids on vehicles of interest. Copart enhances its revenue through ancillary services, such as vehicle transportation and storage, offered to both buyers and sellers.
Additionally, the company monetizes its global network of facilities, leveraging its physical infrastructure for the storage and processing of vehicles. Copart's business model thrives on the efficient and transparent facilitation of the automotive auction process through its online platform, contributing to its position as a leader in the salvage vehicle market.
Here’s a great visualization of Copart’s business model:

2. Is management capable?
Willis Johnson founded Copart in 1982 out of a single scrap yard in California.
Today, he serves as chairman of the board of directors and he still owns 6.66% of the company.
The story about Willis Johnson and the early days of Copart has been published in the book ‘Junk to Gold’, a must-read for everyone who wants to learn more about Copart.
Today, Willis Johnson’s son-in-law Jay Adair is still the co-CEO of Copart together with Jeff Liaw. Jay Adair owns 3.75% of Copart.
In total, insiders own 11.14% of the company. This means we’re talking about an Owner-Operator stock. Copart has performed really well under Willis Johnson and Jay Adair.

3. Does the company have a sustainable competitive advantage?
Copart has a sustainable competitive advantage based on network effects and economies of scale.
Network effects: The more buyers and sellers use Copart’s auction, the better the selling prices for sellers and the easier it is for buyers to find the vehicle they need. Copart’s auction platform is the largest in the world with 750,000 users in 170 countries. This is virtually impossible to match for new entrants
Economies of scale: It took Copart decades to acquire the number of locations it owns today. Insurers operate all over the country so Copart's many locations have the advantage that there is always one nearby. Due to its size, Copart can usually guarantee to pick up damaged vehicles within 24 hours. To transport the vehicles, the company has its own fleet at its disposal and if that is not enough, it can rely on relationships with external transport companies.
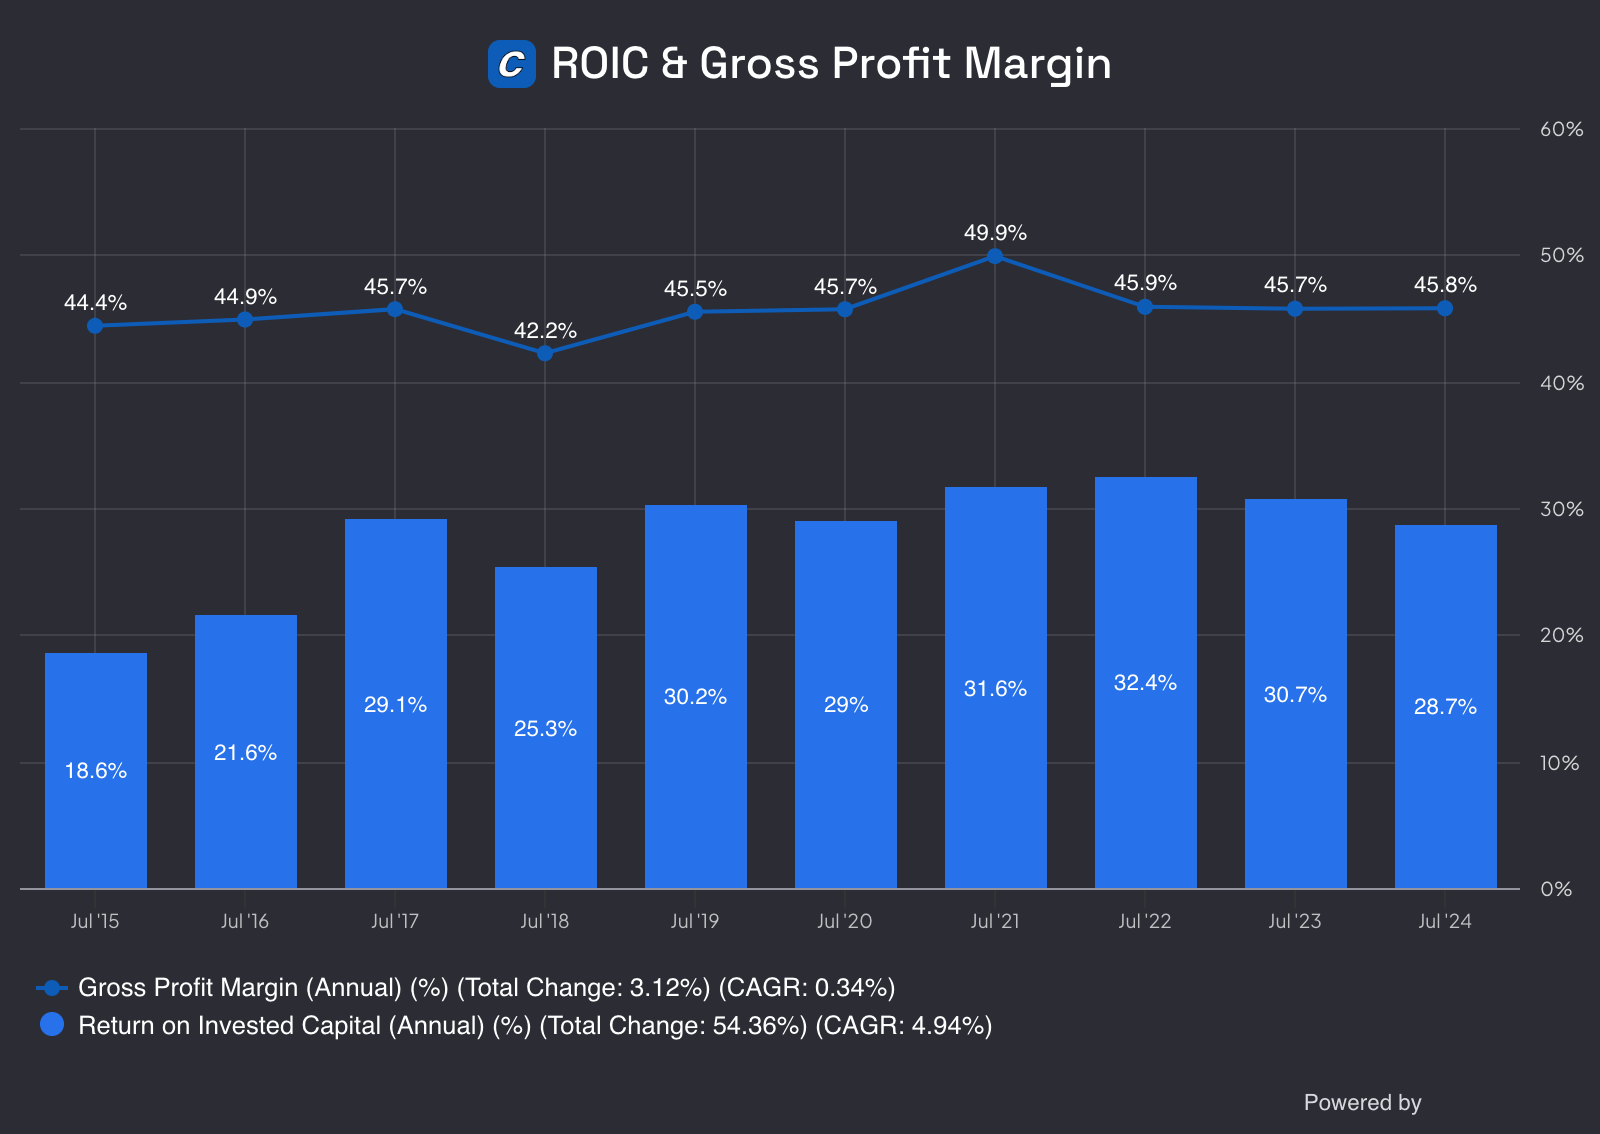
A high and robust Gross Margin and ROIC often characterize companies with a sustainable competitive advantage:
We aim for a Gross Margin > 40% and ROIC > 15%. Copart ticks both boxes.
4. Is the company active in an attractive end market?
In the years to come, Copart should benefit from 2 main growth drivers:
Higher total loss frequency:
Total loss frequency is the number of vehicles that are declared total losses instead of being repaired.
Rising auction prices
Rising auction prices result in higher commissions for Copart.
In the United States, Copart is active in a duopoly together with Insurance Auto Auctions (IAA). Both companies have a market share of roughly 40%.
While IAA isn’t a listed company, fundamentally Copart is a way better business.
5. What are the main risks for the company?
Some of the main risks for Copart:
The most important clients for Copart are large insurance clients. These clients can have some pricing power compared to Copart
More safety in cars will result in fewer accidents and fewer cars that are declared a total loss
A slowdown in the economy or a recession can lead to reduced demand for used and salvaged vehicles
Changes in regulations related to salvage vehicle auctions
Can Copart successfully expand internationally?
The rise of electric vehicles, ridesharing, and autonomous driving
6. Does the company have a healthy balance sheet?
We look at 3 ratios to determine the healthiness of Copart’s balance sheet:
Interest Coverage: 82.4x
Net Debt/FCF: Net cash position (5.3% market cap = cash)
Goodwill/Assets: 6.8%
Copart’s balance sheet looks very healthy. The company has a net cash position and almost no goodwill on its balance sheet.
7. Does the company need a lot of capital to operate?
We prefer to invest in companies with CAPEX/Sales lower than 5% and CAPEX/Operating Cash Flow lower than 25%.
Copart:
CAPEX/Sales: 13.1%
CAPEX/Operating Cash Flow: 36.8%
This capital intensity looks quite high, right?
But hold on!
Remember that there is a difference between Maintenance CAPEX and Growth CAPEX.
Maintenance CAPEX: Investments made in existing assets
Growth CAPEX: Investments made in new assets in order to grow
When a company invests a lot in order to grow, its growth CAPEX is very high but these investments might create a lot of value in the long term.
That’s why sometimes (like for Copart) it might make sense to only take the company’s Maintenance CAPEX into account.
As a rule of thumb, we state that the company’s maintenance CAPEX is equal to the company’s Depreciation & Amortiziation.
CAPEX = Maintenance CAPEX + Growth CAPEX
Wherein Maintenance CAPEX = Depreciation & Amortization
CAPEX Copart = $142.8 million (Maintenance CAPEX) + $383.4 million (Growth CAPEX)
When we only take Copart’s Maintenance CAPEX into account, we get the following:
CAPEX/Sales: 3.6%
CAPEX/Operating Cash Flow: 10.0%
These numbers already look way more attractive.
Another positive? The heavy investments in future growth also mean that the current Free Cash Flow of Copart is an underestimation of economic reality.
Why? These investments heavily reduce the company’s current free cash flow but these investments will result in a higher FCF in the future.
Now let’s dive into the most important Fundamentals of Copart.
We’ll also give Copart a Total Quality Score and decide whether we’ll buy the company.
8. Is the company a great capital allocator?
Capital allocation is the most important task of management.
Look for companies that put the money of shareholders to work at an attractive rate of return.
Copart:
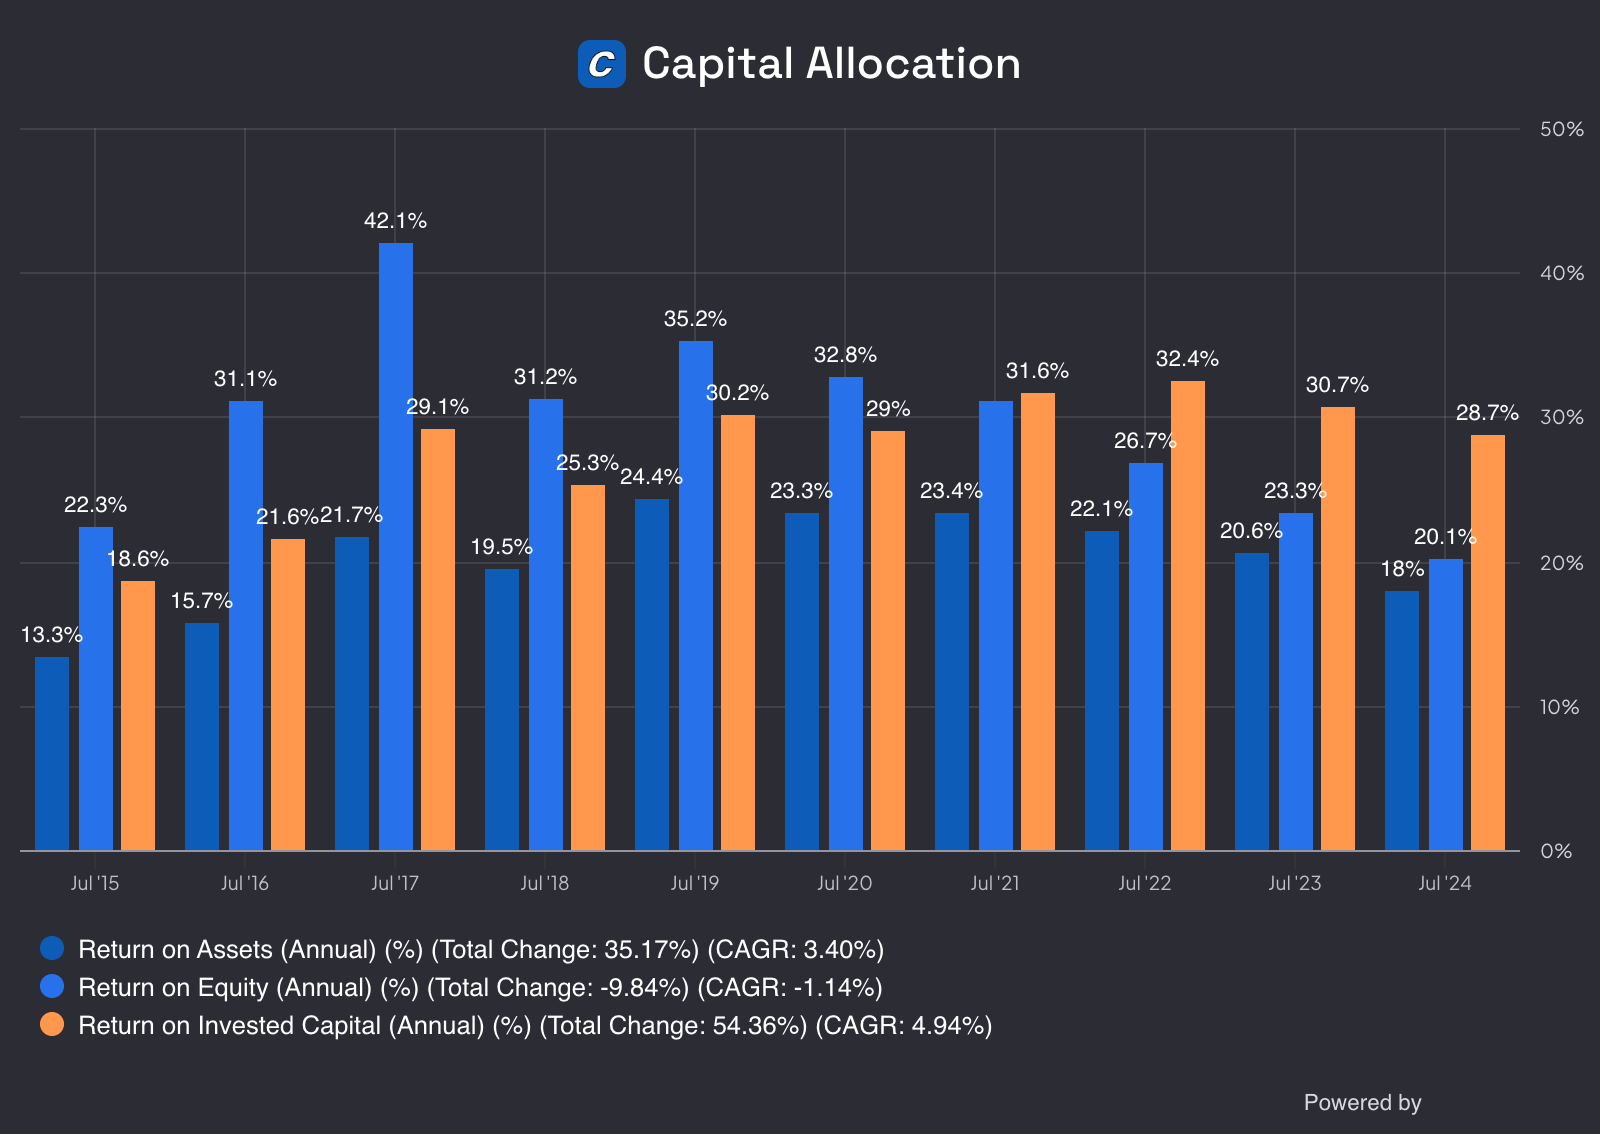
Return On Assets: 15.2%
Return On Equity: 23.5%
Return On Invested Capital: 32.0%
These numbers look attractive as we want the ROIC to be at least 15%.
Here’s an evolution of Copart’s Return On Assets (ROA), ROE and ROIC:
9. How profitable is the company?
The higher the profitability of the company, the better.
We seek companies with robust gross margins, a profit margin of at least 10% and we want most Net Income to be translated into Free Cash Flow.
Here’s how things look like for Copart:
Gross Margin: 46.6%
Profit Margin: 33.1%
FCF/Net Income: 68.3%
The main reason for the lower FCF/Net Income is that Copart is investing heavily in future growth (see point in 7 of this investment case). As a result, a lower FCF/Net Income is not a negative thing
10. Does the company use a lot of Stock-Based Compensation?
Stock-based compensation is a cost for shareholders and should be treated accordingly.
Preferably we want SBCs as a % of Net Income to be lower than 4%.
SBCs as a % of Net Income higher than 10% are seen as a bad thing according to Compounding Quality.
Copart:
SBCs as a % of Net Income: 2.8%
Avg. SBC as a % of Net Income past 5 years: 3.4%
As you can see, Copart doesn’t use a lot of Stock-Based Compensation to reward employees.
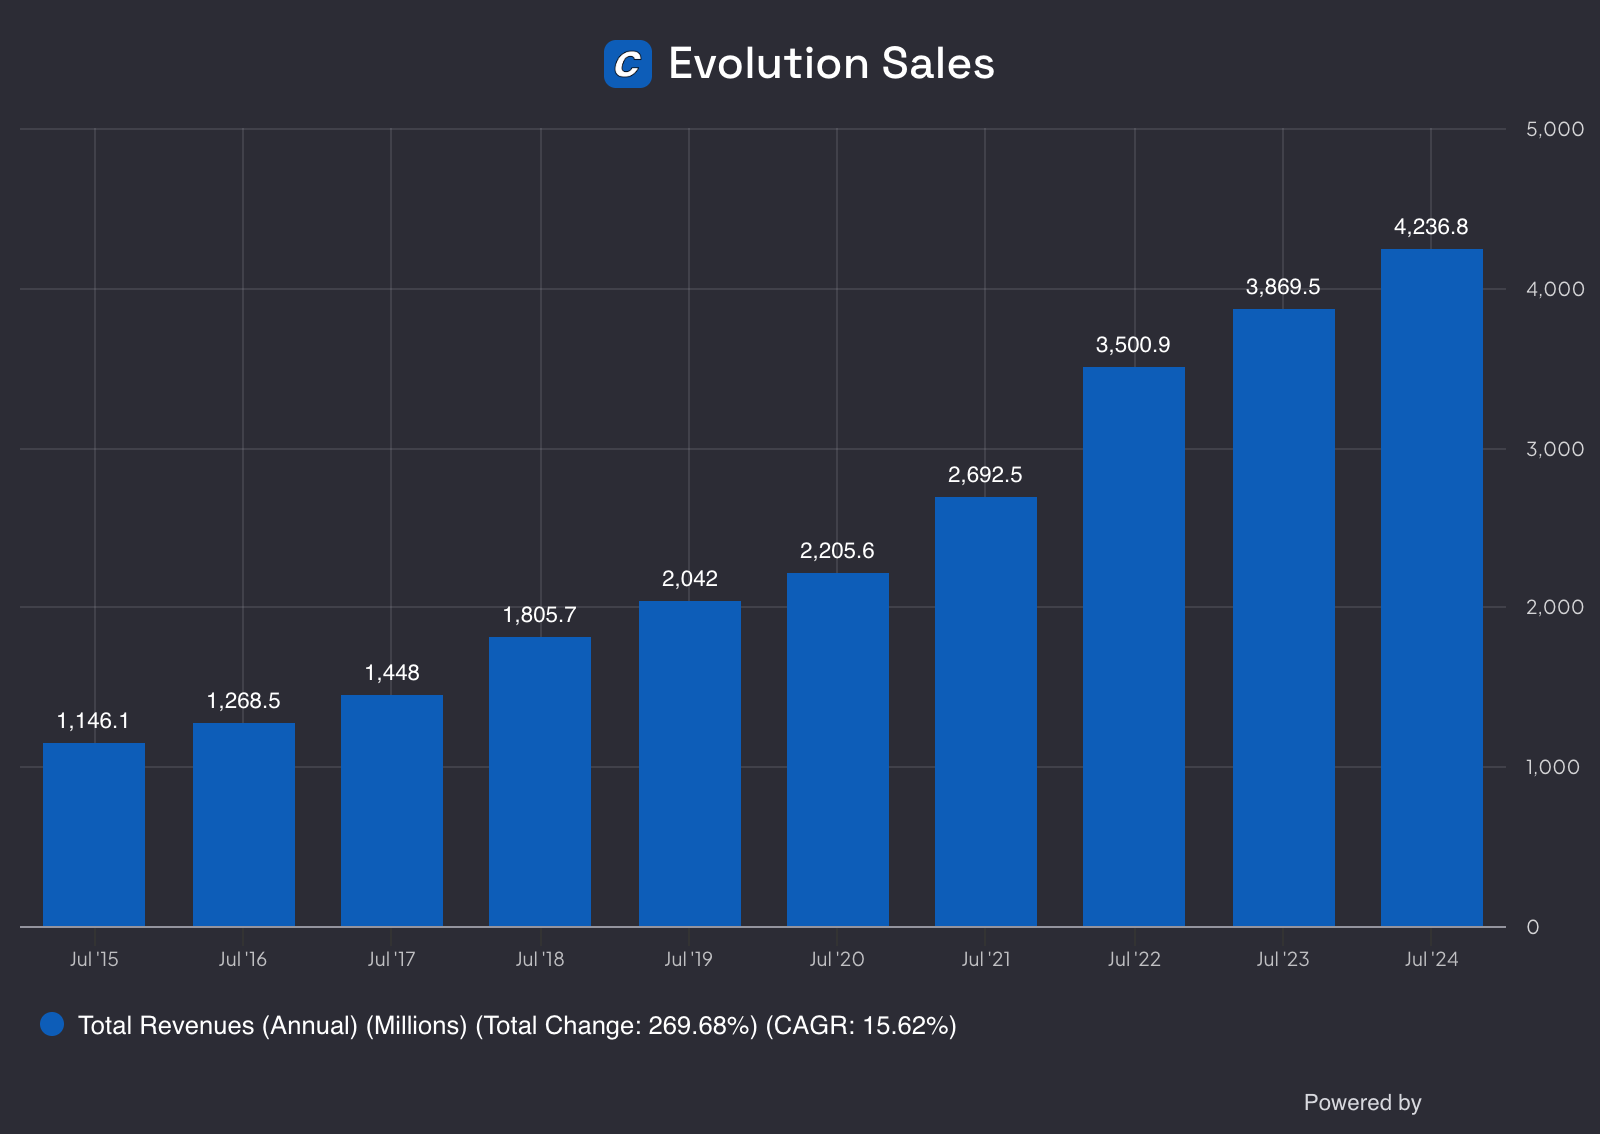
11. Did the company grow at attractive rates in the past?
We seek for companies that managed to grow their revenue and EPS by at least 5% and 7% per year respectively.
Copart:
Revenue Growth past 5 years (CAGR): 14.4%
Revenue Growth past 10 years (CAGR): 13.1%
EPS Growth past 5 years (CAGR): 15.7%
EPS Growth past 10 years (CAGR): 13.8%
12. Does the future look bright?
You want to invest in companies that manage to grow at attractive rates as stock prices tend to follow EPS growth over time.
Copart:
Exp. Revenue Growth next 2 years (CAGR): 8.7%
Exp. EBITDA Growth next 2 years (CAGR): 12.0%
Long-Term Growth Estimate EPS (CAGR): 15.0%
This outlook looks attractive.
13. Does the company trade at a fair valuation level?
We always use 3 methods to look at the valuation of a company:
A comparison of the forward PE multiple with its historical average
Earnings Growth Model
Reverse Discounted-Cash Flow
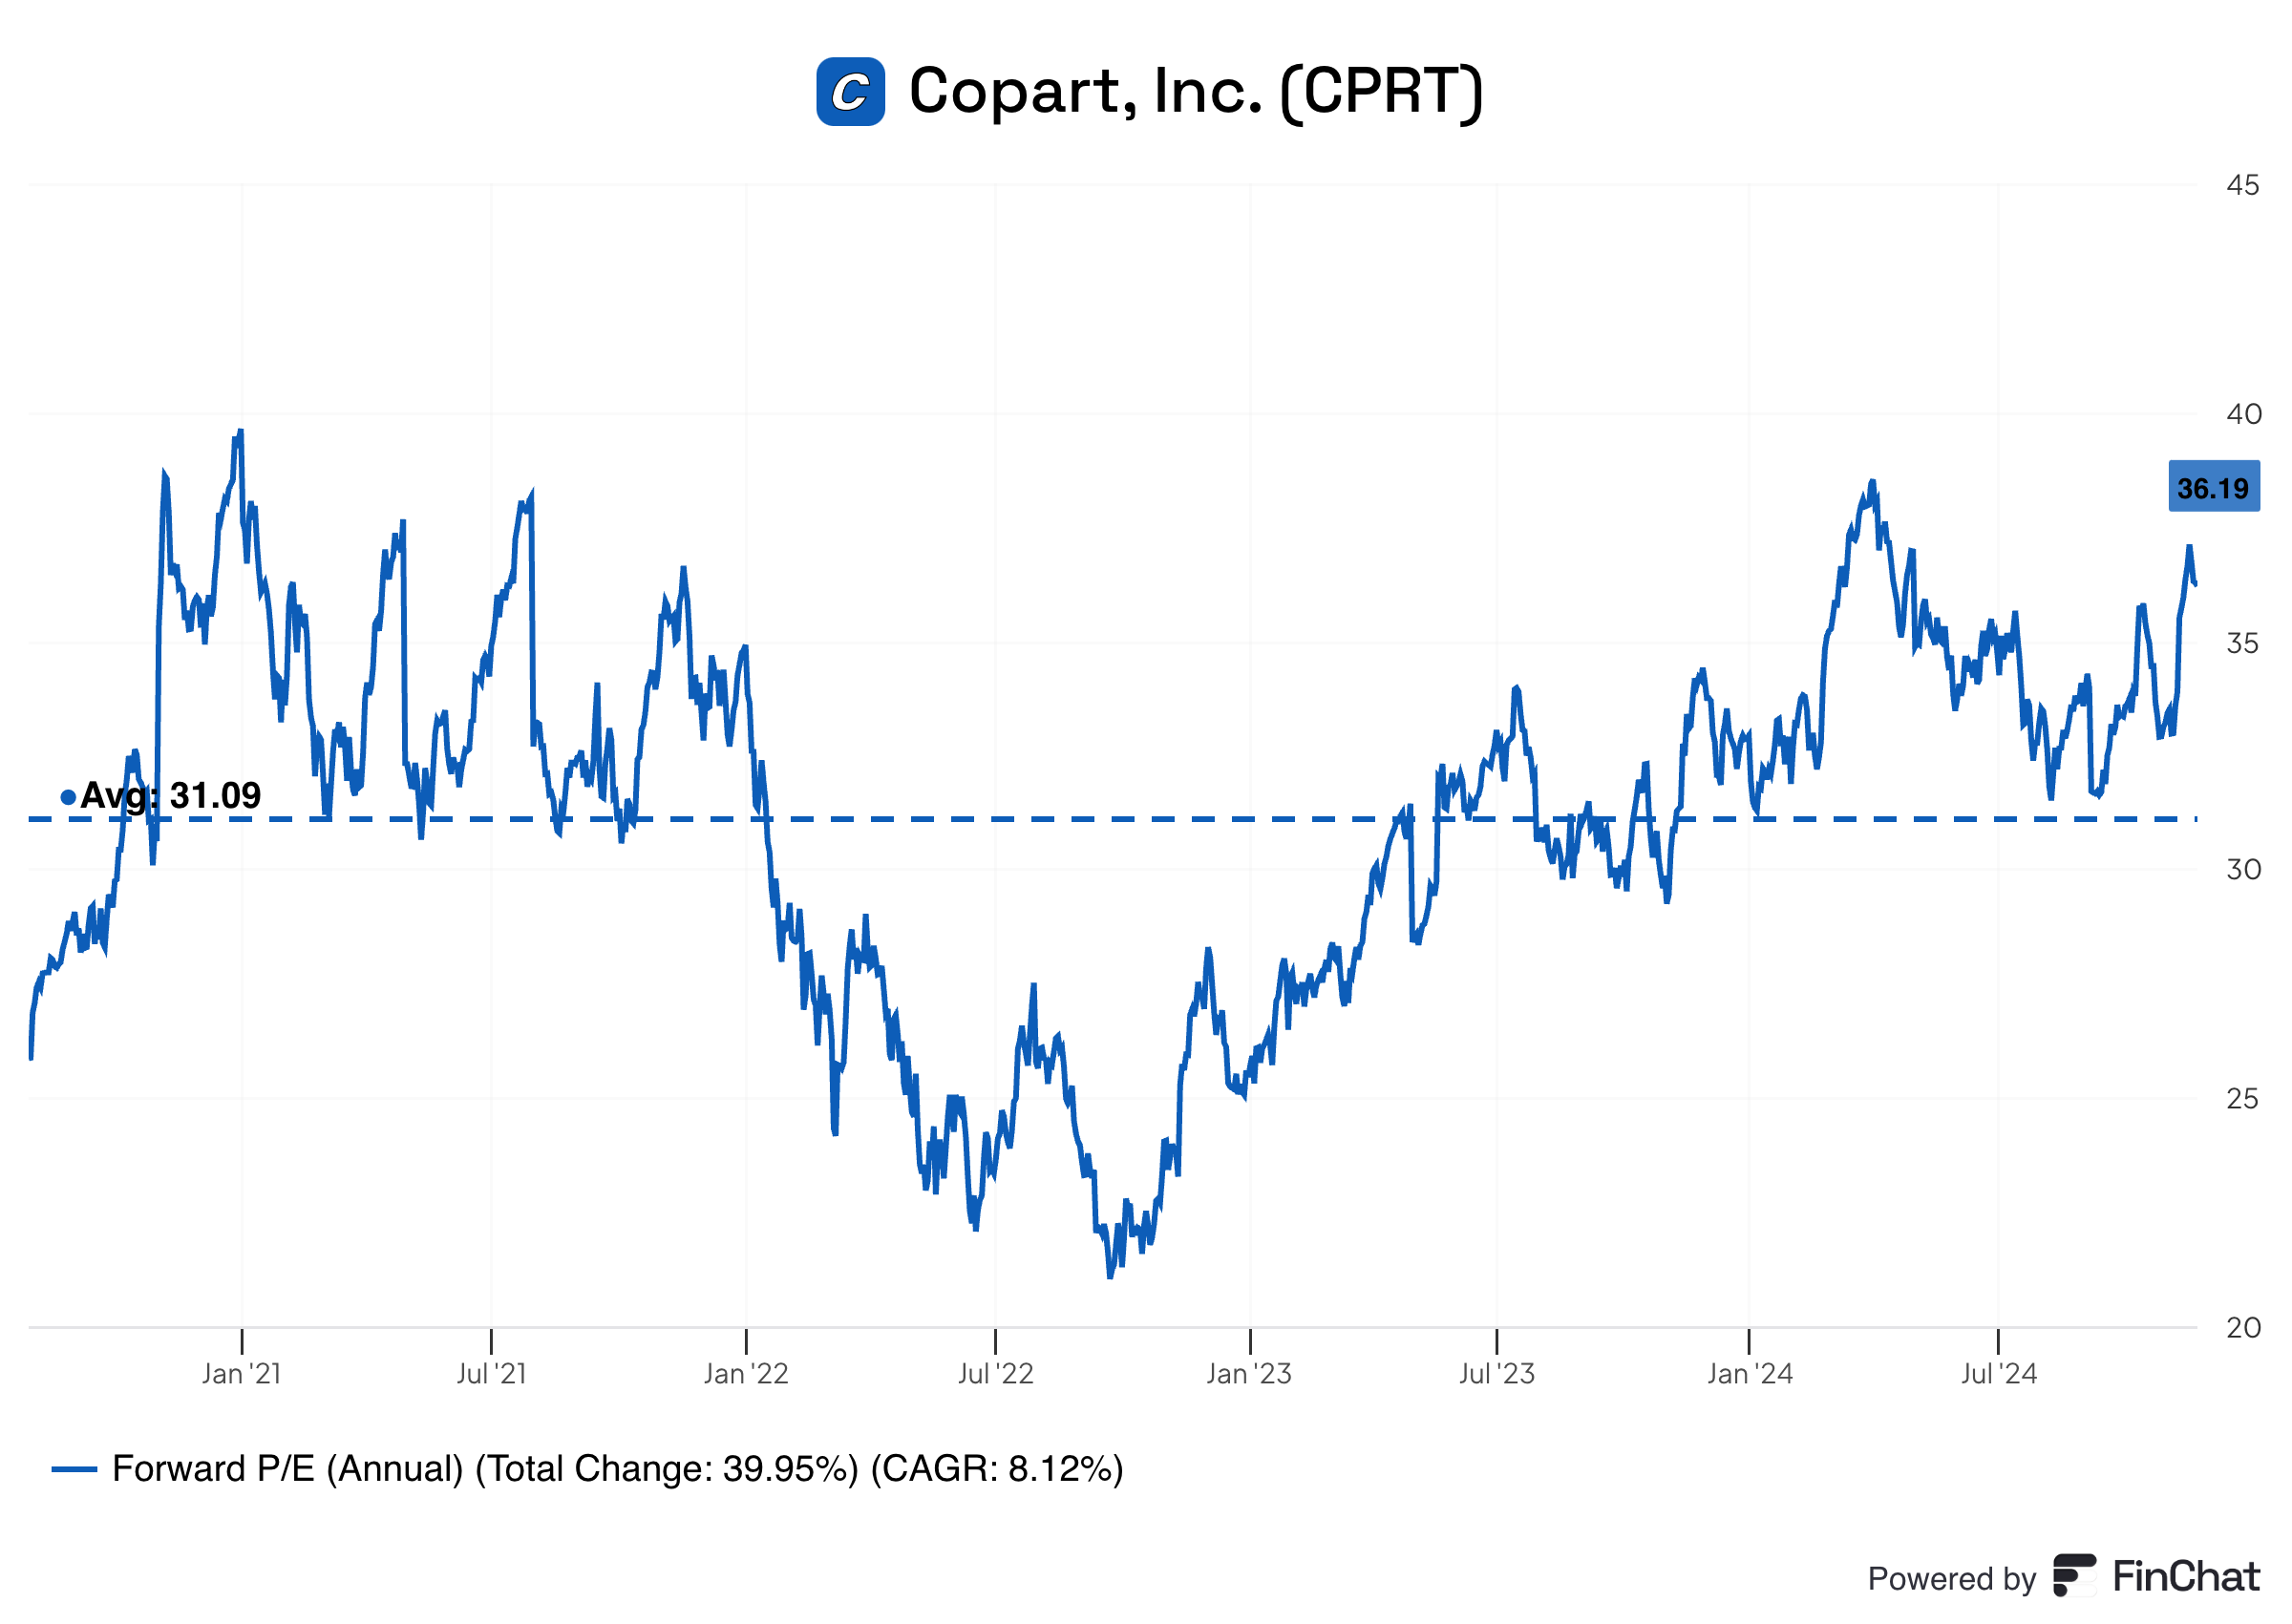
A comparison of the multiple with the historical average
The first thing we do is compare the current forward PE with its historical average over the past 5 and 10 years.
Today, Copart trades at a forward PE of 36.2x versus a historical average of 31.1xover the past 5 years.
This indicates that Copart trades at rich valuation levels.
Earnings Growth Model
This model shows you the yearly return you can expect as an investor.
In theory, it’s really easy to calculate your expected return:
Expected return = EPS growth + Dividend Yield +/- Multiple Expansion (Contraction)
Please note that my expected earnings growth of 12% is lower than the consensus of analysts. It’s because I like to use a margin of safety.
Here are the assumptions I use:
EPS Growth = 12% per year over the next 10 years
Dividend Yield = 0.0%
Forward PE to decline from 36.2x to 25.0x over the next 10 years
Expected yearly return = 12.0% + 0.0% - 0.1* ((25-36.2)/36.2))= 8.9%
An expected yearly return of 8.9% looks good, but ideally we would like this number to be a bit higher.
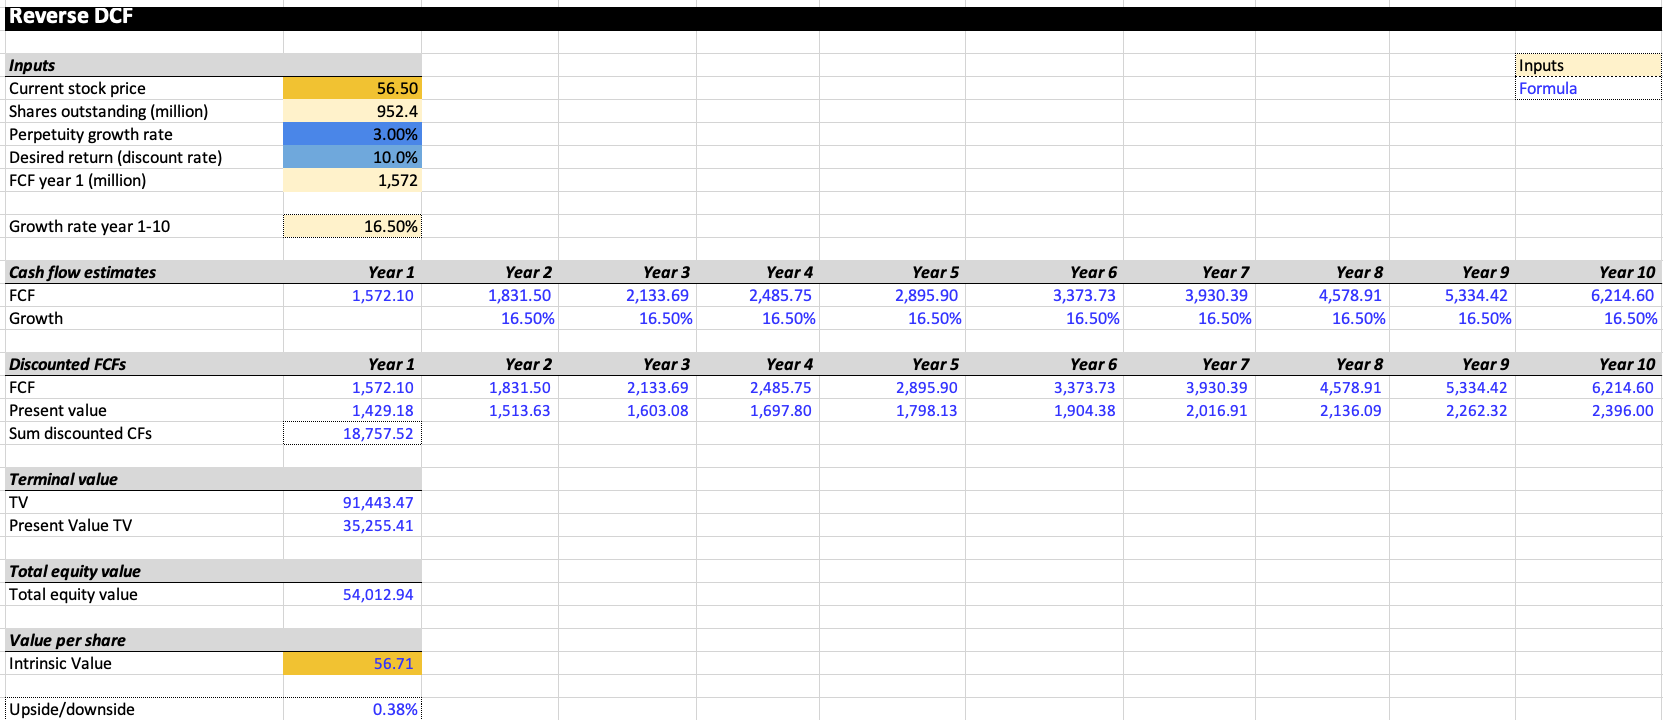
Reverse DCF
Charlie Munger once said that if you want to find the solution to a complex problem, you should revert. Always revert. Turn the problem upside down.
A reverse DCF shows you the expectations that are implied in the current stock price.
You try to determine for yourself whether these expectations are realistic or not.
You can learn more about a reverse DCF here: Reverse DCF 101.
The consensus states that Copart’s Free Cash Flow over the next 12 months will be equal to $1.188.7 million.
But please note that Copart is investing heavily in future growth which is why I add the growth CAPEX of $383.4 million to the company’s Free Cash Flow again.
Under these assumptions, our Reverse DCF indicates that Copart should grow its Free Cash Flow by 16.5% per year to return 10% per year to shareholders.
14. How did the Owner’s Earnings of the company evolve in the past?
Over time, stock prices tend to follow the Owner’s Earnings of a company (EPS Growth + Dividend Yield).
That’s why we want to invest in companies that managed to grow their Owner’s Earnings at attractive rates in the past. This is the case for Copart.
Copart:
CAGR Owner’s Earnings past 5 years: 28.2%
CAGR Owner’s Earnings past 10 years: 19.8%
15. Did the company create a lot of shareholder value in the past?
We want to invest in companies that managed to compound at attractive rates in the past.
Ideally, the company returned more than 12% per year to shareholders since their IPO.
Here’s how the performance of Copart looks like:
YTD: +19.0%
5-year CAGR: +21.2%
CAGR since IPO (1994): +21.3%
Bringing everything together
That’s it for today.
In the full article (only for Premium Subscribers), I bring everything together.
This means I give Copart a Quality Score on all of the 15 metrics and I determine whether we’ll buy the company or not.
Premium Subscribers get the following:

Everything In Life Compounds
Pieter (Compounding Quality)
PS Currently you get a $100 discount on a yearly subscription ($399 instead of $499)
Used sources
Interactive Brokers: Portfolio data and executing all transactions
Finchat: Financial data